U-Haul 2016 Annual Report Download - page 30
Download and view the complete annual report
Please find page 30 of the 2016 U-Haul annual report below. You can navigate through the pages in the report by either clicking on the pages listed below, or by using the keyword search tool below to find specific information within the annual report.-
 1
1 -
2
-
3
-
4
-
5
-
6
-
7
-
8
-
9
-
10
-
11
-
12
-
13
-
14
-
15
-
16
-
17
-
18
-
19
-
 20
20 -
 21
21 -
 22
22 -
 23
23 -
 24
24 -
 25
25 -
 26
26 -
 27
27 -
 28
28 -
 29
29 -
 30
30 -
 31
31 -
 32
32 -
 33
33 -
 34
34 -
 35
35 -
 36
36 -
 37
37 -
 38
38 -
 39
39 -
 40
40 -
41
-
42
-
43
-
44
-
45
-
46
-
47
-
48
-
49
-
50
-
51
-
52
-
53
-
54
-
55
-
56
-
57
-
58
-
59
-
60
-
61
-
62
-
63
-
64
-
65
-
66
-
67
-
68
-
69
-
70
-
71
-
72
-
73
-
74
-
75
-
76
-
77
-
78
-
79
-
80
-
81
-
82
-
83
-
84
-
85
-
86
-
87
-
88
-
89
-
90
-
91
-
92
-
93
-
94
-
95
-
96
-
97
-
98
-
99
-
100
-
101
-
102
-
103
-
104
-
105
-
106
-
107
-
108
-
109
-
110
-
111
-
112
-
113
-
114
-
115
-
116
-
117
-
118
-
119
-
120
-
121
-
122
-
123
-
124
-
125
-
126
-
127
-
128
-
129
-
130
 |
 |

24
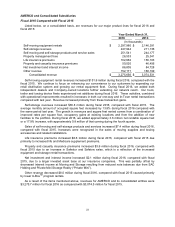
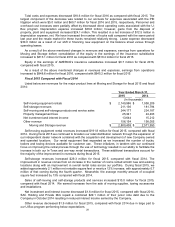
Listed below are revenues and earnings from operations at each of our operating segments for fiscal
2016 and 2015. The insurance companies’ years ended December 31, 2015 and 2014.
Year Ended March 31,
2016
2015
(In thousands)
Moving and storage
Revenues
$
2,984,504
$
2,800,438
Earnings from operations before equity in earnings of subsidiaries
813,124
610,430
Property and casualty insurance
Revenues
64,803
59,275
Earnings from operations
24,547
23,477
Life insurance
Revenues
231,220
219,656
Earnings from operations
29,773
29,755
Eliminations
Revenues
(4,871)
(4,838)
Earnings from operations before equity in earnings of subsidiaries
(630)
(638)
Consolidated Results
Revenues
3,275,656
3,074,531
Earnings from operations
866,814
663,024
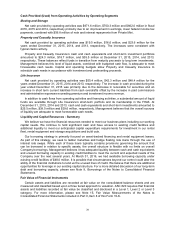
Total costs and expenses decreased $2.7 million during fiscal 2016, compared with fiscal 2015. Total
costs at Moving and Storage decreased $18.6 million. The largest component of the decrease was
related to our accruals for expenses associated with the PEI litigation which were $5.0 million and $60.7
million for fiscal 2016 and 2015, respectively. Personnel and overhead cost increases were partially offset
by decreased direct operating costs associated with the U-Box program. Depreciation expense increased
$36.6 million; however, gains from the disposal of property, plant and equipment increased $24.1 million.
This resulted in a net increase of $12.5 million in depreciation expense, net. We have increased the
number of trucks sold compared with the same period last year and the resale market for these trucks
remained relatively strong. Lease expense decreased $30.0 million as a result of our shift in financing
new equipment on the balance sheet versus through operating leases. Total costs and expenses in the
insurance segments increased $15.9 million primarily due to expenses associated with additional new
business written.
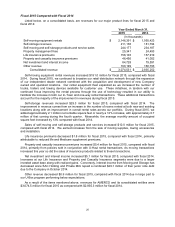
As a result of the above mentioned changes in revenues and expenses, earnings from operations
increased to $866.8 million for fiscal 2016, compared with $663.0 million for fiscal 2015.
Interest expense for fiscal 2016 was $97.9 million, compared with $97.5 million for fiscal 2015 due to
an increase in average borrowings partially offset by a decrease in average borrowing costs.
Income tax expense was $279.9 million for fiscal 2016, compared with $204.7 million for fiscal 2015.
The increase was due to higher pretax earnings for fiscal 2016. The effective tax rate was 36.4% and
36.5% for fiscal 2016 and 2015, respectively.
As a result of the above mentioned items, earnings available to common shareholders were $489.0
million for fiscal 2016, compared with $356.7 million for fiscal 2015.
Basic and diluted earnings per common share for fiscal 2016 were $24.95, compared with $18.21 for
fiscal 2015.
The weighted average common shares outstanding basic and diluted were 19,596,110 for fiscal 2016,
compared with 19,586,633 for fiscal 2015.