U-Haul 2016 Annual Report Download - page 37
Download and view the complete annual report
Please find page 37 of the 2016 U-Haul annual report below. You can navigate through the pages in the report by either clicking on the pages listed below, or by using the keyword search tool below to find specific information within the annual report.-
 1
1 -
2
-
3
-
4
-
5
-
6
-
7
-
8
-
9
-
10
-
11
-
12
-
13
-
14
-
15
-
16
-
17
-
18
-
19
-
20
-
21
-
22
-
23
-
24
-
25
-
26
-
 27
27 -
 28
28 -
 29
29 -
 30
30 -
 31
31 -
 32
32 -
 33
33 -
 34
34 -
 35
35 -
 36
36 -
 37
37 -
 38
38 -
 39
39 -
 40
40 -
 41
41 -
 42
42 -
 43
43 -
 44
44 -
 45
45 -
 46
46 -
 47
47 -
48
-
49
-
50
-
51
-
52
-
53
-
54
-
55
-
56
-
57
-
58
-
59
-
60
-
61
-
62
-
63
-
64
-
65
-
66
-
67
-
68
-
69
-
70
-
71
-
72
-
73
-
74
-
75
-
76
-
77
-
78
-
79
-
80
-
81
-
82
-
83
-
84
-
85
-
86
-
87
-
88
-
89
-
90
-
91
-
92
-
93
-
94
-
95
-
96
-
97
-
98
-
99
-
100
-
101
-
102
-
103
-
104
-
105
-
106
-
107
-
108
-
109
-
110
-
111
-
112
-
113
-
114
-
115
-
116
-
117
-
118
-
119
-
120
-
121
-
122
-
123
-
124
-
125
-
126
-
127
-
128
-
129
-
130
 |
 |

31
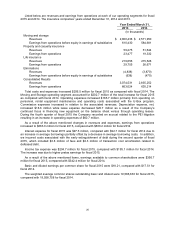
Net operating expenses were $22.5 million and $23.7 million for the years ended December 31, 2014
and 2013, respectively. The variance was due to a reduction in commission expenses on declining
earned premiums.
Benefits and losses incurred were $147.8 million and $145.2 million for the years ended December 31,
2014 and 2013, respectively. Life benefits increased $2.5 million resulting from higher mortality exposure.
Medicare supplement benefits decreased $1.1 million from a reduction in the in force on the existing
blocks offset by the increased benefits from new sales. Annuity benefits decreased $1.3 million due to the
reserve reduction in single premium annuities and guaranteed life withdrawal benefit rider.
Supplementary contract payments increased $0.2 million. Increase in interest credited to policyholders
was $2.2 million as a result of a larger annuity account value.
Amortization of deferred acquisition costs (“DAC”), sales inducement asset (“SIA”) and the value of
business acquired (“VOBA”) was $19.7 million and $20.0 million for the years ended December 31, 2014
and 2013, respectively.
As a result of the above mentioned changes in revenues and expenses, pretax earnings from
operations were $29.8 million and $26.7 million for the year ended December 31, 2014 and 2013,
respectively.
Liquidity and Capital Resources
We believe our current capital structure is a positive factor that will enable us to pursue our operational
plans and goals and provide us with sufficient liquidity for the foreseeable future. There are many factors
which could affect our liquidity, including some which are beyond our control, and there is no assurance
that future cash flows and liquidity resources will be sufficient to meet our outstanding debt obligations
and our other future capital needs.
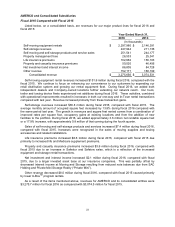
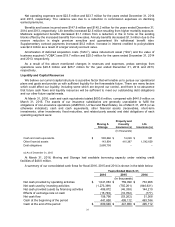
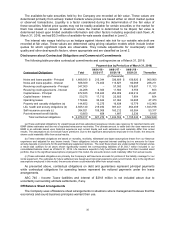
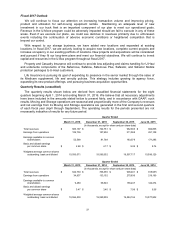
At March 31, 2016, cash and cash equivalents totaled $600.6 million, compared with $441.9 million on
March 31, 2015. The assets of our insurance subsidiaries are generally unavailable to fulfill the
obligations of non-insurance operations (AMERCO, U-Haul and Real Estate). As of March 31, 2016 (or as
otherwise indicated), cash and cash equivalents, other financial assets (receivables, short-term
investments, other investments, fixed maturities, and related party assets) and debt obligations of each
operating segment were:
Moving &
Storage
Property and
Casualty
Insurance (a)
Life
Insurance (a)
(In thousands)
Cash and cash equivalents
$
585,666
$
14,049
$
931
Other financial assets
143,904
410,387
1,542,629
Debt obligations
2,688,758
–
–
(a) As of December 31, 2015
At March 31, 2016, Moving and Storage had available borrowing capacity under existing credit
facilities of $48.0 million.
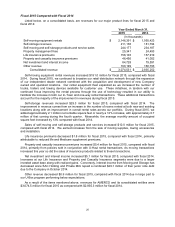
A summary of our consolidated cash flows for fiscal 2016, 2015 and 2014 is shown in the table below:
Years Ended March 31,
2016
2015
2014
(In thousands)
Net cash provided by operating activities
$
1,041,063
$
759,099
$
733,966
Net cash used by investing activities
(1,273,399)
(755,261)
(846,631)
Net cash provided (used) by financing activities
406,872
(46,338)
144,210
Effects of exchange rate on cash
(15,740)
(10,762)
(177)
Net cash flow
158,796
(53,262)
31,368
Cash at the beginning of the period
441,850
495,112
463,744
Cash at the end of the period
$
600,646
$
441,850
$
495,112