U-Haul 2016 Annual Report Download - page 33
Download and view the complete annual report
Please find page 33 of the 2016 U-Haul annual report below. You can navigate through the pages in the report by either clicking on the pages listed below, or by using the keyword search tool below to find specific information within the annual report.-
 1
1 -
2
-
3
-
4
-
5
-
6
-
7
-
8
-
9
-
10
-
11
-
12
-
13
-
14
-
15
-
16
-
17
-
18
-
19
-
20
-
21
-
22
-
 23
23 -
 24
24 -
 25
25 -
 26
26 -
 27
27 -
 28
28 -
 29
29 -
 30
30 -
 31
31 -
 32
32 -
 33
33 -
 34
34 -
 35
35 -
 36
36 -
 37
37 -
 38
38 -
 39
39 -
 40
40 -
 41
41 -
 42
42 -
 43
43 -
44
-
45
-
46
-
47
-
48
-
49
-
50
-
51
-
52
-
53
-
54
-
55
-
56
-
57
-
58
-
59
-
60
-
61
-
62
-
63
-
64
-
65
-
66
-
67
-
68
-
69
-
70
-
71
-
72
-
73
-
74
-
75
-
76
-
77
-
78
-
79
-
80
-
81
-
82
-
83
-
84
-
85
-
86
-
87
-
88
-
89
-
90
-
91
-
92
-
93
-
94
-
95
-
96
-
97
-
98
-
99
-
100
-
101
-
102
-
103
-
104
-
105
-
106
-
107
-
108
-
109
-
110
-
111
-
112
-
113
-
114
-
115
-
116
-
117
-
118
-
119
-
120
-
121
-
122
-
123
-
124
-
125
-
126
-
127
-
128
-
129
-
130
 |
 |

27
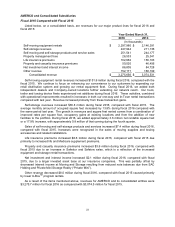
Moving and Storage
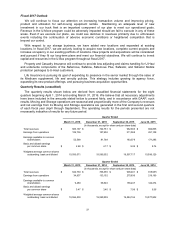
Fiscal 2016 Compared with Fiscal 2015
Listed below are revenues for the major product lines at Moving and Storage for fiscal 2016 and fiscal
2015:
Year Ended March 31,
2016
2015
(In thousands)
Self-moving equipment rentals
$
2,301,586
$
2,149,986
Self-storage revenues
247,944
211,136
Self-moving and self-storage products and service sales
251,541
244,177
Property management fees
26,533
25,341
Net investment and interest income
8,801
13,644
Other revenue
148,099
156,154
Moving and Storage revenue
$
2,984,504
$
2,800,438
Self-moving equipment rental revenues increased $151.6 million during fiscal 2016, compared with
fiscal 2015. We continue to focus on enhancing our convenience to our customers by expanding our
retail distribution system and growing our rental equipment fleet. During fiscal 2016, we added both
independent dealers and Company-owned locations further extending our network reach. Our truck,
trailer and towing device fleets experienced net additions during fiscal 2016. These activities, combined
with operational improvements resulted in increases in both our one-way and In-Town rental transactions
compared with last year. Revenue increased primarily from these transaction gains.
Self-storage revenues increased $36.8 million during fiscal 2016, compared with fiscal 2015. The
average monthly amount of occupied square feet increased by 13.8% during fiscal 2016 compared with
the same period last year. The growth in revenues and square feet rented comes from a combination of
improved rates per square foot, occupancy gains at existing locations and from the addition of new
facilities to the portfolio. During fiscal 2016, we added approximately 3.6 million net rentable square feet
or a 17.9% increase, with approximately 0.8 million of that coming during the fourth quarter.
Sales of self-moving and self-storage products and services increased $7.4 million during fiscal 2016,
compared with fiscal 2015. Increases were recognized in the sales of moving supplies and towing
accessories and related installations.
Net investment and interest income decreased $4.8 million during fiscal 2016, compared with fiscal
2015. Reduced note balances due from SAC Holding and Private Mini resulted in decreased interest
income.
Other revenue decreased $8.1 million during fiscal 2016, compared with fiscal 2015 caused primarily
by lower U-BoxTM program rentals.
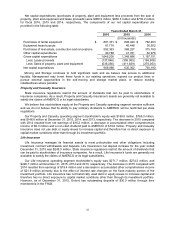
The Company owns and manages self-storage facilities. Self-storage revenues reported in the
consolidated financial statements represent Company-owned locations only. Self-storage data for our
owned storage locations follows:
Year Ended March 31,
2016
2015
(In thousands, except occupancy rate)
Room count as of March 31
275
232
Square footage as of March 31
23,951
20,318
Average monthly number of rooms occupied
203
180
Average monthly occupancy rate based on room count
80.1%
81.7%
Average monthly square footage occupied
18,231
16,021