U-Haul 2016 Annual Report Download - page 59
Download and view the complete annual report
Please find page 59 of the 2016 U-Haul annual report below. You can navigate through the pages in the report by either clicking on the pages listed below, or by using the keyword search tool below to find specific information within the annual report.-
 1
1 -
2
-
3
-
4
-
5
-
6
-
7
-
8
-
9
-
10
-
11
-
12
-
13
-
14
-
15
-
16
-
17
-
18
-
19
-
20
-
21
-
22
-
23
-
24
-
25
-
26
-
27
-
28
-
29
-
30
-
31
-
32
-
33
-
34
-
35
-
36
-
37
-
38
-
39
-
40
-
41
-
42
-
43
-
44
-
45
-
46
-
47
-
48
-
 49
49 -
 50
50 -
 51
51 -
 52
52 -
 53
53 -
 54
54 -
 55
55 -
 56
56 -
 57
57 -
 58
58 -
 59
59 -
 60
60 -
 61
61 -
 62
62 -
 63
63 -
 64
64 -
 65
65 -
 66
66 -
 67
67 -
 68
68 -
 69
69 -
70
-
71
-
72
-
73
-
74
-
75
-
76
-
77
-
78
-
79
-
80
-
81
-
82
-
83
-
84
-
85
-
86
-
87
-
88
-
89
-
90
-
91
-
92
-
93
-
94
-
95
-
96
-
97
-
98
-
99
-
100
-
101
-
102
-
103
-
104
-
105
-
106
-
107
-
108
-
109
-
110
-
111
-
112
-
113
-
114
-
115
-
116
-
117
-
118
-
119
-
120
-
121
-
122
-
123
-
124
-
125
-
126
-
127
-
128
-
129
-
130
 |
 |

F-3
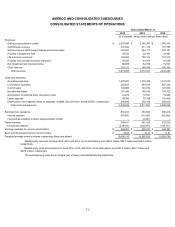
AMERCO AND CONSOLIDATED SUBSIDIARIES
CONSOLIDATED STATEMENTS OF OPERATIONS
Years Ended March 31,
2016
2015
2014
(In thousands, except share and per share data)
Revenues:
Self-moving equipment rentals
$
2,297,980
$
2,146,391
$
1,955,423
Self-storage revenues
247,944
211,136
181,794
Self-moving and self-storage products and service sales
251,541
244,177
234,187
Property management fees
26,533
25,341
24,493
Life insurance premiums
162,662
156,103
157,919
Property and casualty insurance premiums
50,020
46,456
41,052
Net investment and interest income
86,805
84,728
79,591
Other revenue
152,171
160,199
160,793
Total revenues
3,275,656
3,074,531
2,835,252
Costs and expenses:
Operating expenses
1,470,047
1,479,409
1,313,674
Commission expenses
262,627
249,642
227,332
Cost of sales
144,990
146,072
127,270
Benefits and losses
167,436
158,760
156,702
Amortization of deferred policy acquisition costs
23,272
19,661
19,982
Lease expense
49,780
79,798
100,466
Depreciation, net of (gains) losses on disposals of (($98,703), ($74,631) and ($33,557), respectively)
290,690
278,165
259,612
Total costs and expenses
2,408,842
2,411,507
2,205,038
Earnings from operations
866,814
663,024
630,214
Interest expense
(97,903)
(97,525)
(92,692)
Fees and amortization on early extinguishment of debt
–
(4,081)
–
Pretax earnings
768,911
561,418
537,522
Income tax expense
(279,910)
(204,677)
(195,131)
Earnings available to common stockholders
$
489,001
$
356,741
$
342,391
Basic and diluted earnings per common share
$
24.95
$
18.21
$
17.51
Weighted average common shares outstanding: Basic and diluted
19,596,110
19,586,633
19,558,758
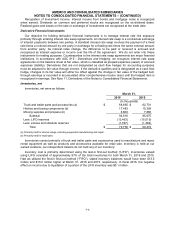
Related party revenues for fiscal 2016, 2015 and 2014, net of eliminations, were $32.6 million, $36.2 million and $36.9 million,
respectively.
Related party costs and expenses for fiscal 2016, 2015, and 2014, net of eliminations, were $57.4 million, $54.7 million and
$52.6 million, respectively.
The accompanying notes are an integral part of these consolidated financial statements.