U-Haul 2016 Annual Report Download - page 80
Download and view the complete annual report
Please find page 80 of the 2016 U-Haul annual report below. You can navigate through the pages in the report by either clicking on the pages listed below, or by using the keyword search tool below to find specific information within the annual report.-
 1
1 -
2
-
3
-
4
-
5
-
6
-
7
-
8
-
9
-
10
-
11
-
12
-
13
-
14
-
15
-
16
-
17
-
18
-
19
-
20
-
21
-
22
-
23
-
24
-
25
-
26
-
27
-
28
-
29
-
30
-
31
-
32
-
33
-
34
-
35
-
36
-
37
-
38
-
39
-
40
-
41
-
42
-
43
-
44
-
45
-
46
-
47
-
48
-
49
-
50
-
51
-
52
-
53
-
54
-
55
-
56
-
57
-
58
-
59
-
60
-
61
-
62
-
63
-
64
-
65
-
66
-
67
-
68
-
69
-
 70
70 -
 71
71 -
 72
72 -
 73
73 -
 74
74 -
 75
75 -
 76
76 -
 77
77 -
 78
78 -
 79
79 -
 80
80 -
 81
81 -
 82
82 -
 83
83 -
 84
84 -
 85
85 -
 86
86 -
 87
87 -
 88
88 -
 89
89 -
 90
90 -
91
-
92
-
93
-
94
-
95
-
96
-
97
-
98
-
99
-
100
-
101
-
102
-
103
-
104
-
105
-
106
-
107
-
108
-
109
-
110
-
111
-
112
-
113
-
114
-
115
-
116
-
117
-
118
-
119
-
120
-
121
-
122
-
123
-
124
-
125
-
126
-
127
-
128
-
129
-
130
 |
 |

AMERCO AND CONSOLIDATED SUBSIDIARIES
NOTES TO CONSOLIDATED FINANCIAL STATEMENTS – (CONTINUED)
F-24
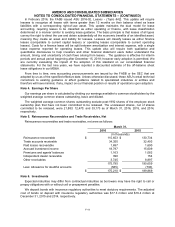
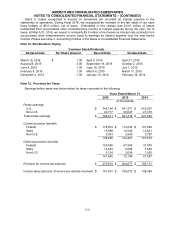
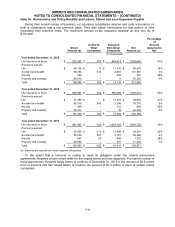
The difference between the tax provision at the statutory federal income tax rate and the tax provision
attributable to income before taxes was as follows:
Years Ended March 31,
2016
2015
2014
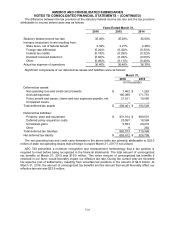
Statutory federal income tax rate
35.00%
35.00%
35.00%
Increase (reduction) in rate resulting from:
State taxes, net of federal benefit
2.34%
2.21%
2.38%
Foreign rate differential
(0.24)%
(0.32)%
(0.33)%
Federal tax credits
(0.19)%
(0.29)%
(0.32)%
Dividend received deduction
(0.02)%
(0.03)%
(0.03)%
Other
(0.49)%
(0.11)%
(0.40)%
Actual tax expense of operations
36.40%
36.46%
36.30%
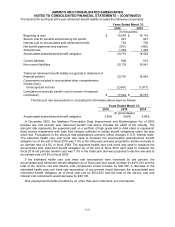
Significant components of our deferred tax assets and liabilities were as follows:
March 31,
2016
2015
(In thousands)
Deferred tax assets:
Net operating loss and credit carry forwards
$
1,462
$
1,228
Accrued expenses
185,088
171,761
Policy benefit and losses, claims and loss expenses payable, net
21,911
19,560
Unrealized losses
–
–
Total deferred tax assets
$
208,461
$
192,549
Deferred tax liabilities:
Property, plant and equipment
$
831,914
$
680,501
Deferred policy acquisition costs
20,557
18,369
Unrealized gains
9,593
20,216
Other
9
262
Total deferred tax liabilities
862,073
719,348
Net deferred tax liability
$
653,612
$
526,799
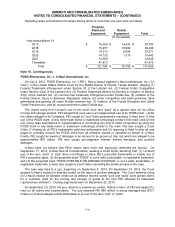
The net operating loss and credit carry-forwards in the above table are primarily attributable to $22.0
million of state net operating losses that will begin to expire March 31, 2017 if not utilized.
ASC 740 prescribes a minimum recognition and measurement methodology that a tax position is
required to meet before being recognized in the financial statements. The total amount of unrecognized
tax benefits at March 31, 2015 was $19.9 million. This entire amount of unrecognized tax benefits if
resolved in our favor, would favorably impact our effective tax rate. During the current year we recorded
tax expense (net of settlements), resulting from uncertain tax positions in the amount of $4.0 million. At
March 31, 2016, the amount of unrecognized tax benefits and the amount that would favorably affect our
effective tax rate was $23.9 million.