U-Haul 2016 Annual Report Download - page 61
Download and view the complete annual report
Please find page 61 of the 2016 U-Haul annual report below. You can navigate through the pages in the report by either clicking on the pages listed below, or by using the keyword search tool below to find specific information within the annual report.-
 1
1 -
2
-
3
-
4
-
5
-
6
-
7
-
8
-
9
-
10
-
11
-
12
-
13
-
14
-
15
-
16
-
17
-
18
-
19
-
20
-
21
-
22
-
23
-
24
-
25
-
26
-
27
-
28
-
29
-
30
-
31
-
32
-
33
-
34
-
35
-
36
-
37
-
38
-
39
-
40
-
41
-
42
-
43
-
44
-
45
-
46
-
47
-
48
-
49
-
50
-
 51
51 -
 52
52 -
 53
53 -
 54
54 -
 55
55 -
 56
56 -
 57
57 -
 58
58 -
 59
59 -
 60
60 -
 61
61 -
 62
62 -
 63
63 -
 64
64 -
 65
65 -
 66
66 -
 67
67 -
 68
68 -
 69
69 -
 70
70 -
 71
71 -
72
-
73
-
74
-
75
-
76
-
77
-
78
-
79
-
80
-
81
-
82
-
83
-
84
-
85
-
86
-
87
-
88
-
89
-
90
-
91
-
92
-
93
-
94
-
95
-
96
-
97
-
98
-
99
-
100
-
101
-
102
-
103
-
104
-
105
-
106
-
107
-
108
-
109
-
110
-
111
-
112
-
113
-
114
-
115
-
116
-
117
-
118
-
119
-
120
-
121
-
122
-
123
-
124
-
125
-
126
-
127
-
128
-
129
-
130
 |
 |

F-5
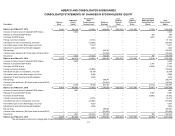
AMERCO AND CONSOLIDATED SUBSIDIARIES
CONSOLIDATED STATEMENTS OF CHANGES IN STOCKHOLDERS’ EQUITY
Description
Common
Stock
Additional
Paid-In
Capital
Accumulated
Other
Comprehensive
Income (Loss)
Retained
Earnings
Less:
Treasury
Common
Stock
Less:
Treasury
Preferred
Stock
Less: Unearned
Employee Stock
Ownership Plan
Shares
Total
Stockholders'
Equity
(In thousands)
Balance as of March 31, 2013
$
10,497
$
438,168
$
(22,680)
$
1,482,630
$
(525,653)
$
(151,997)
$
(1,706)
$
1,229,259
Increase in market value of released ESOP shares
–
6,042
–
–
–
–
–
6,042
Release of unearned ESOP shares
–
–
–
–
–
–
694
694
Purchase of ESOP shares
–
–
–
–
–
–
(207)
(207)
Foreign currency translation
–
–
(9,134)
–
–
–
–
(9,134)
Unrealized net loss on investments, net of tax
–
–
(33,654)
–
–
–
–
(33,654)
Fair market value of cash flow hedges, net of tax
–
–
11,977
–
–
–
–
11,977
Adjustment to post retirement benefit obligation
–
–
(432)
–
–
–
–
(432)
Net earnings
–
–
–
342,391
–
–
–
342,391
Common stock dividend: ($1.00 per share for fiscal 2014)
–
–
–
(19,568)
–
–
–
(19,568)
Net activity
–
6,042
(31,243)
322,823
–
–
487
298,109
Balance as of March 31, 2014
$
10,497
$
444,210
$
(53,923)
$
1,805,453
$
(525,653)
(151,997)
$
(1,219)
$
1,527,368
Increase in market value of released ESOP shares
–
5,458
–
–
–
–
–
5,458
Release of unearned ESOP shares
–
–
–
–
–
–
2,767
2,767
Purchase of ESOP shares
–
–
–
–
–
–
(7,939)
(7,939)
Foreign currency translation
–
–
(19,883)
–
–
–
–
(19,883)
Unrealized net gain on investments, net of tax
–
–
35,190
–
–
–
–
35,190
Fair market value of cash flow hedges, net of tax
–
–
5,086
–
–
–
–
5,086
Adjustment to post retirement benefit obligation
–
–
(835)
–
–
–
–
(835)
Net earnings
–
–
–
356,741
–
–
–
356,741
Common stock dividends: ($1.00 per share for fiscal 2015)
–
–
–
(19,594)
–
–
–
(19,594)
Net activity
–
5,458
19,558
337,147
–
–
(5,172)
356,991
Balance as of March 31, 2015
$
10,497
$
449,668
$
(34,365)
$
2,142,600
$
(525,653)
$
(151,997)
$
(6,391)
$
1,884,359
Increase in market value of released ESOP shares
–
1,961
–
–
–
–
–
1,961
Release of unearned ESOP shares
–
–
–
–
–
–
9,507
9,507
Purchase of ESOP shares
–
–
–
–
–
–
(9,302)
(9,302)
Foreign currency translation
–
–
(4,473)
–
–
–
–
(4,473)
Unrealized net loss on investments, net of tax
–
–
(27,066)
–
–
–
–
(27,066)
Fair market value of cash flow hedges, net of tax
–
–
6,027
–
–
–
–
6,027
Adjustment to post retirement benefit obligation
–
–
(648)
–
–
–
–
(648)
Net earnings
–
–
–
489,001
–
–
–
489,001
Common stock dividends: ($5.00 per share for fiscal 2016)
–
–
–
(97,960)
–
–
–
(97,960)
Net activity
–
1,961
(26,160)
391,041
–
–
205
367,047
Balance as of March 31, 2016
$
10,497
$
451,629
$
(60,525)
$
2,533,641
$
(525,653)
$
(151,997)
$
(6,186)
$
2,251,406
The accompanying notes are an integral part of these consolidated financial statements.