U-Haul 2016 Annual Report Download - page 73
Download and view the complete annual report
Please find page 73 of the 2016 U-Haul annual report below. You can navigate through the pages in the report by either clicking on the pages listed below, or by using the keyword search tool below to find specific information within the annual report.-
 1
1 -
2
-
3
-
4
-
5
-
6
-
7
-
8
-
9
-
10
-
11
-
12
-
13
-
14
-
15
-
16
-
17
-
18
-
19
-
20
-
21
-
22
-
23
-
24
-
25
-
26
-
27
-
28
-
29
-
30
-
31
-
32
-
33
-
34
-
35
-
36
-
37
-
38
-
39
-
40
-
41
-
42
-
43
-
44
-
45
-
46
-
47
-
48
-
49
-
50
-
51
-
52
-
53
-
54
-
55
-
56
-
57
-
58
-
59
-
60
-
61
-
62
-
 63
63 -
 64
64 -
 65
65 -
 66
66 -
 67
67 -
 68
68 -
 69
69 -
 70
70 -
 71
71 -
 72
72 -
 73
73 -
 74
74 -
 75
75 -
 76
76 -
 77
77 -
 78
78 -
 79
79 -
 80
80 -
 81
81 -
 82
82 -
 83
83 -
84
-
85
-
86
-
87
-
88
-
89
-
90
-
91
-
92
-
93
-
94
-
95
-
96
-
97
-
98
-
99
-
100
-
101
-
102
-
103
-
104
-
105
-
106
-
107
-
108
-
109
-
110
-
111
-
112
-
113
-
114
-
115
-
116
-
117
-
118
-
119
-
120
-
121
-
122
-
123
-
124
-
125
-
126
-
127
-
128
-
129
-
130
 |
 |

AMERCO AND CONSOLIDATED SUBSIDIARIES
NOTES TO CONSOLIDATED FINANCIAL STATEMENTS – (CONTINUED)
F-17
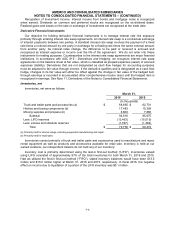
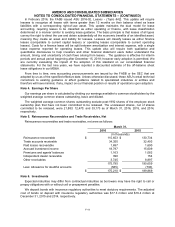
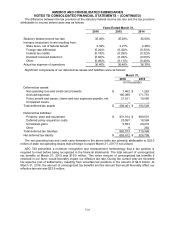
Investments, other
The carrying value of other investments was as follows:
March 31,
2016
2015
(In thousands)
Mortgage loans, net
$
217,198
$
161,851
Short-term investments
34,798
47,739
Real estate
34,416
34,597
Policy loans
17,091
16,431
Other equity investments
6,569
8,102
$
310,072
$
268,720
Mortgage loans are carried at the unpaid balance, less an allowance for probable losses net of any
unamortized premium or discount. The allowance for probable losses was $0.4 million as of March 31,
2016 and 2015. The estimated fair value of these loans as of March 31, 2016 and 2015 approximated the
carrying value. These loans represent first lien mortgages held by us.
Short-term investments consist primarily of investments in money market funds, mutual funds and any
other investments with short-term characteristics that have original maturities of less than one year at
acquisition. These investments are recorded at cost, which approximates fair value.
Real estate obtained through foreclosure and held for sale is carried at the lower of fair value at time of
foreclosure or current estimated fair value less cost to sell. Other equity investments are carried at cost
and assessed for impairment.
Insurance policy loans are carried at their unpaid balance.
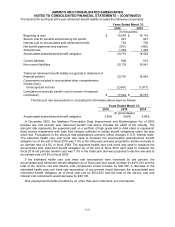
Note 7. Other Assets
Other assets were as follows:
March 31,
2016
2015
(In thousands)
Deposits (debt-related)
$
30,660
$
49,467
Cash surrender value of life insurance policies
31,619
30,563
Deferred charges (debt-related)
23,362
16,575
Other
14,931
9,552
$
100,572
$
106,157
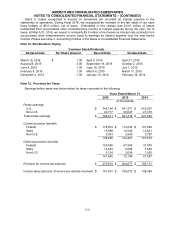
Note 8. Net Investment and Interest Income
Net investment and interest income, were as follows:
Years Ended March 31,
2016
2015
2014
(In thousands)
Fixed maturities
$
63,641
$
58,716
$
53,634
Real estate
3,775
2,669
1,118
Insurance policy loans
1,188
1,072
1,159
Mortgage loans
14,631
10,677
9,450
Short-term, amounts held by ceding reinsurers, net and other investments
208
2,724
3,440
Investment income
83,443
75,858
68,801
Less: investment expenses
(2,724)
(1,962)
(1,629)
Investment income - related party
6,086
10,832
12,419
Net investment and interest income
$
86,805
$
84,728
$
79,591