U-Haul 2016 Annual Report Download - page 101
Download and view the complete annual report
Please find page 101 of the 2016 U-Haul annual report below. You can navigate through the pages in the report by either clicking on the pages listed below, or by using the keyword search tool below to find specific information within the annual report.-
 1
1 -
2
-
3
-
4
-
5
-
6
-
7
-
8
-
9
-
10
-
11
-
12
-
13
-
14
-
15
-
16
-
17
-
18
-
19
-
20
-
21
-
22
-
23
-
24
-
25
-
26
-
27
-
28
-
29
-
30
-
31
-
32
-
33
-
34
-
35
-
36
-
37
-
38
-
39
-
40
-
41
-
42
-
43
-
44
-
45
-
46
-
47
-
48
-
49
-
50
-
51
-
52
-
53
-
54
-
55
-
56
-
57
-
58
-
59
-
60
-
61
-
62
-
63
-
64
-
65
-
66
-
67
-
68
-
69
-
70
-
71
-
72
-
73
-
74
-
75
-
76
-
77
-
78
-
79
-
80
-
81
-
82
-
83
-
84
-
85
-
86
-
87
-
88
-
89
-
90
-
 91
91 -
 92
92 -
 93
93 -
 94
94 -
 95
95 -
 96
96 -
 97
97 -
 98
98 -
 99
99 -
 100
100 -
 101
101 -
 102
102 -
 103
103 -
 104
104 -
 105
105 -
 106
106 -
 107
107 -
 108
108 -
 109
109 -
 110
110 -
 111
111 -
112
-
113
-
114
-
115
-
116
-
117
-
118
-
119
-
120
-
121
-
122
-
123
-
124
-
125
-
126
-
127
-
128
-
129
-
130
 |
 |

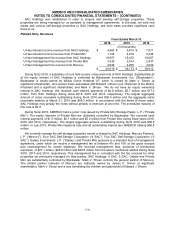
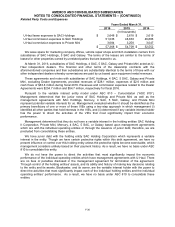
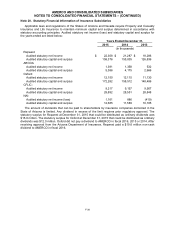
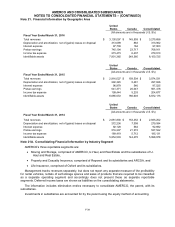
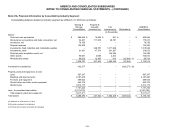
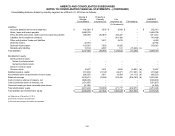
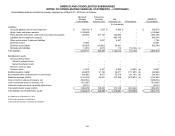
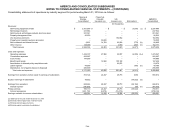
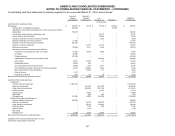
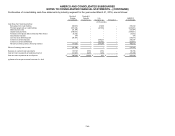
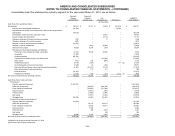
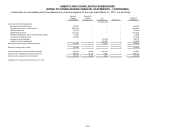
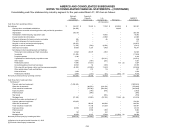
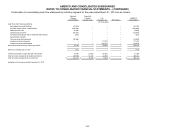
AMERCO AND CONSOLIDATED SUBSIDIARIES
NOTES TO CONSOLIDATED FINANCIAL STATEMENTS – (CONTINUED)
F-45
Consolidating statements of operations by industry segment for period ending March 31, 2015 are as follows:
Moving &
Storage
Consolidated
Property &
Casualty
Insurance (a)
Life
Insurance (a)
Eliminations
AMERCO
Consolidated
(In thousands)
Revenues:
Self-moving equipment rentals
$
2,149,986
$
–
$
–
$
(3,595)
(c)
$
2,146,391
Self-storage revenues
211,136
–
–
–
211,136
Self-moving & self-storage products & service sales
244,177
–
–
–
244,177
Property management fees
25,341
–
–
–
25,341
Life insurance premiums
–
–
156,103
–
156,103
Property and casualty insurance premiums
–
46,456
–
–
46,456
Net investment and interest income
13,644
12,819
59,051
(786)
(b)
84,728
Other revenue
156,154
–
4,502
(457)
(b)
160,199
Total revenues
2,800,438
59,275
219,656
(4,838)
3,074,531
Costs and expenses:
Operating expenses
1,436,145
24,802
22,476
(4,014)
(b,c)
1,479,409
Commission expenses
249,642
–
–
–
249,642
Cost of sales
146,072
–
–
–
146,072
Benefits and losses
–
10,996
147,764
–
158,760
Amortization of deferred policy acquisition costs
–
–
19,661
–
19,661
Lease expense
79,984
–
–
(186)
(b)
79,798
Depreciation, net of (gains) losses on disposals
278,165
–
–
–
278,165
Total costs and expenses
2,190,008
35,798
189,901
(4,200)
2,411,507
Earnings from operations before equity in earnings of subsidiaries
610,430
23,477
29,755
(638)
663,024
Equity in earnings of subsidiaries
34,783
–
–
(34,783)
(d)
–
Earnings from operations
645,213
23,477
29,755
(35,421)
663,024
Interest expense
(98,163)
–
–
638
(b)
(97,525)
Fees and amortization on early extinguishment of debt
(4,081)
–
–
–
(4,081)
Pretax earnings
542,969
23,477
29,755
(34,783)
561,418
Income tax expense
(186,228)
(8,060)
(10,389)
–
(204,677)
Earnings available to common shareholders
$
356,741
$
15,417
$
19,366
$
(34,783)
$
356,741
(a) Balances for the year ended December 31, 2014
(b) Eliminate intercompany lease/interest income
(c) Eliminate intercompany premiums
(d) Eliminate equity in earnings of subsidiaries