U-Haul 2016 Annual Report Download - page 96
Download and view the complete annual report
Please find page 96 of the 2016 U-Haul annual report below. You can navigate through the pages in the report by either clicking on the pages listed below, or by using the keyword search tool below to find specific information within the annual report.-
 1
1 -
2
-
3
-
4
-
5
-
6
-
7
-
8
-
9
-
10
-
11
-
12
-
13
-
14
-
15
-
16
-
17
-
18
-
19
-
20
-
21
-
22
-
23
-
24
-
25
-
26
-
27
-
28
-
29
-
30
-
31
-
32
-
33
-
34
-
35
-
36
-
37
-
38
-
39
-
40
-
41
-
42
-
43
-
44
-
45
-
46
-
47
-
48
-
49
-
50
-
51
-
52
-
53
-
54
-
55
-
56
-
57
-
58
-
59
-
60
-
61
-
62
-
63
-
64
-
65
-
66
-
67
-
68
-
69
-
70
-
71
-
72
-
73
-
74
-
75
-
76
-
77
-
78
-
79
-
80
-
81
-
82
-
83
-
84
-
85
-
 86
86 -
 87
87 -
 88
88 -
 89
89 -
 90
90 -
 91
91 -
 92
92 -
 93
93 -
 94
94 -
 95
95 -
 96
96 -
 97
97 -
 98
98 -
 99
99 -
 100
100 -
 101
101 -
 102
102 -
 103
103 -
 104
104 -
 105
105 -
 106
106 -
107
-
108
-
109
-
110
-
111
-
112
-
113
-
114
-
115
-
116
-
117
-
118
-
119
-
120
-
121
-
122
-
123
-
124
-
125
-
126
-
127
-
128
-
129
-
130
 |
 |

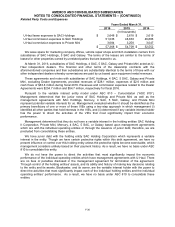
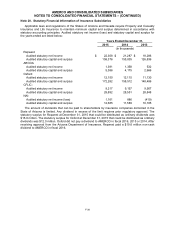
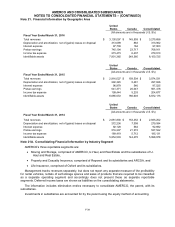
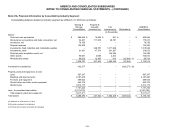
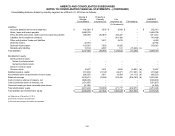
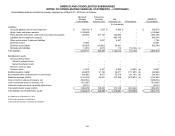
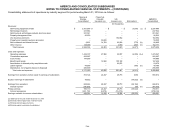
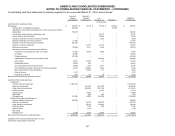
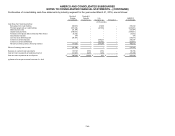
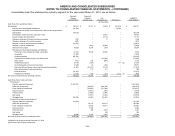
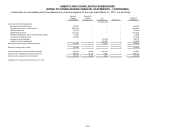
AMERCO AND CONSOLIDATED SUBSIDIARIES
NOTES TO CONSOLIDATED FINANCIAL STATEMENTS – (CONTINUED)
F-40
Note 21A. Financial Information by Consolidating Industry Segment:
Consolidating balance sheets by industry segment as of March 31, 2016 are as follows:
Moving &
Storage
Consolidated
Property &
Casualty
Insurance (a)
Life
Insurance (a)
Eliminations
AMERCO
Consolidated
(In thousands)
Assets:
Cash and cash equivalents
$
585,666
$
14,049
$
931
$
–
$
600,646
Reinsurance recoverables and trade receivables, net
34,451
111,978
28,781
–
175,210
Inventories, net
79,756
–
–
–
79,756
Prepaid expenses
134,300
–
–
–
134,300
Investments, fixed maturities and marketable equities
–
238,570
1,271,968
–
1,510,538
Investments, other
21,431
47,374
241,267
–
310,072
Deferred policy acquisition costs, net
–
–
136,386
–
136,386
Other assets
95,081
3,088
2,403
–
100,572
Related party assets
88,022
12,465
613
(15,366)
(c)
85,734
1,038,707
427,524
1,682,349
(15,366)
3,133,214
Investment in subsidiaries
432,277
–
–
(432,277)
(b)
–
Property, plant and equipment, at cost:
Land
587,347
–
–
–
587,347
Buildings and improvements
2,187,400
–
–
–
2,187,400
Furniture and equipment
399,943
–
–
–
399,943
Rental trailers and other rental equipment
462,379
–
–
–
462,379
Rental trucks
3,514,175
–
–
–
3,514,175
7,151,244
–
–
–
7,151,244
Less: Accumulated depreciation
(2,133,733)
–
–
–
(2,133,733)
Total property, plant and equipment
5,017,511
–
–
–
5,017,511
Total assets
$
6,488,495
$
427,524
$
1,682,349
$
(447,643)
$
8,150,725
(a) Balances as of December 31, 2015
(b) Eliminate investment in subsidiaries
(c) Eliminate intercompany receivables and payables