U-Haul 2016 Annual Report Download - page 106
Download and view the complete annual report
Please find page 106 of the 2016 U-Haul annual report below. You can navigate through the pages in the report by either clicking on the pages listed below, or by using the keyword search tool below to find specific information within the annual report.-
 1
1 -
2
-
3
-
4
-
5
-
6
-
7
-
8
-
9
-
10
-
11
-
12
-
13
-
14
-
15
-
16
-
17
-
18
-
19
-
20
-
21
-
22
-
23
-
24
-
25
-
26
-
27
-
28
-
29
-
30
-
31
-
32
-
33
-
34
-
35
-
36
-
37
-
38
-
39
-
40
-
41
-
42
-
43
-
44
-
45
-
46
-
47
-
48
-
49
-
50
-
51
-
52
-
53
-
54
-
55
-
56
-
57
-
58
-
59
-
60
-
61
-
62
-
63
-
64
-
65
-
66
-
67
-
68
-
69
-
70
-
71
-
72
-
73
-
74
-
75
-
76
-
77
-
78
-
79
-
80
-
81
-
82
-
83
-
84
-
85
-
86
-
87
-
88
-
89
-
90
-
91
-
92
-
93
-
94
-
95
-
 96
96 -
 97
97 -
 98
98 -
 99
99 -
 100
100 -
 101
101 -
 102
102 -
 103
103 -
 104
104 -
 105
105 -
 106
106 -
 107
107 -
 108
108 -
 109
109 -
 110
110 -
 111
111 -
 112
112 -
 113
113 -
 114
114 -
 115
115 -
 116
116 -
117
-
118
-
119
-
120
-
121
-
122
-
123
-
124
-
125
-
126
-
127
-
128
-
129
-
130
 |
 |

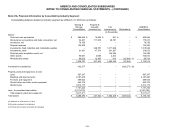
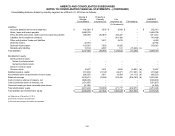
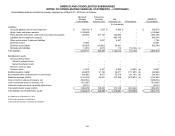
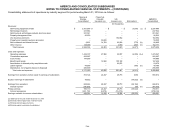
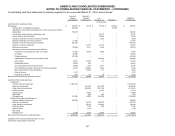
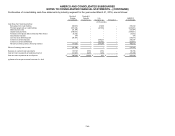
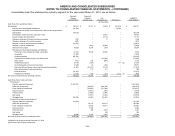
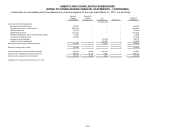
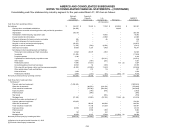
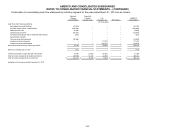
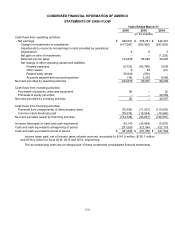
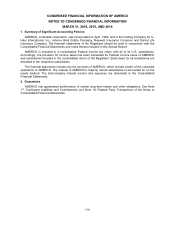
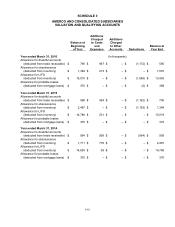
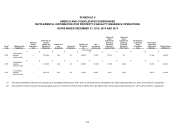
AMERCO AND CONSOLIDATED SUBSIDIARIES
NOTES TO CONSOLIDATED FINANCIAL STATEMENTS – (CONTINUED)
F-50
Continuation of consolidating cash flow statements by industry segment for the year ended March 31, 2015, are as follows:
Moving &
Storage
Consolidated
Property &
Casualty
Insurance (a)
Life
Insurance (a)
Elimination
AMERCO
Consolidated
(In thousands)
Cash flows from financing activities:
Borrowings from credit facilities
657,535
–
–
–
657,535
Principal repayments on credit facilities
(593,722)
–
–
–
(593,722)
Debt issuance costs
(12,327)
–
–
–
(12,327)
Capital lease payments
(121,202)
–
–
–
(121,202)
Purchases of Employee Stock Ownership Plan Shares
(7,939)
–
–
–
(7,939)
Common stock dividends paid
(19,594)
–
–
–
(19,594)
Investment contract deposits
–
–
105,019
–
105,019
Investment contract withdrawals
–
–
(54,108)
–
(54,108)
Net cash provided (used) by financing activities
(97,249)
–
50,911
–
(46,338)
Effects of exchange rate on cash
(10,762)
–
–
–
(10,762)
Increase (decrease) in cash and cash equivalents
(32,837)
(4,263)
(16,162)
–
(53,262)
Cash and cash equivalents at beginning of period
464,710
12,758
17,644
–
495,112
Cash and cash equivalents at end of period
$
431,873
$
8,495
$
1,482
$
–
$
441,850
(a) Balance for the period ended December 31, 2014