U-Haul 2016 Annual Report Download - page 43
Download and view the complete annual report
Please find page 43 of the 2016 U-Haul annual report below. You can navigate through the pages in the report by either clicking on the pages listed below, or by using the keyword search tool below to find specific information within the annual report.-
 1
1 -
2
-
3
-
4
-
5
-
6
-
7
-
8
-
9
-
10
-
11
-
12
-
13
-
14
-
15
-
16
-
17
-
18
-
19
-
20
-
21
-
22
-
23
-
24
-
25
-
26
-
27
-
28
-
29
-
30
-
31
-
32
-
 33
33 -
 34
34 -
 35
35 -
 36
36 -
 37
37 -
 38
38 -
 39
39 -
 40
40 -
 41
41 -
 42
42 -
 43
43 -
 44
44 -
 45
45 -
 46
46 -
 47
47 -
 48
48 -
 49
49 -
 50
50 -
 51
51 -
 52
52 -
 53
53 -
54
-
55
-
56
-
57
-
58
-
59
-
60
-
61
-
62
-
63
-
64
-
65
-
66
-
67
-
68
-
69
-
70
-
71
-
72
-
73
-
74
-
75
-
76
-
77
-
78
-
79
-
80
-
81
-
82
-
83
-
84
-
85
-
86
-
87
-
88
-
89
-
90
-
91
-
92
-
93
-
94
-
95
-
96
-
97
-
98
-
99
-
100
-
101
-
102
-
103
-
104
-
105
-
106
-
107
-
108
-
109
-
110
-
111
-
112
-
113
-
114
-
115
-
116
-
117
-
118
-
119
-
120
-
121
-
122
-
123
-
124
-
125
-
126
-
127
-
128
-
129
-
130
 |
 |

37
Fiscal 2017 Outlook
We will continue to focus our attention on increasing transaction volume and improving pricing,
product and utilization for self-moving equipment rentals. Maintaining an adequate level of new
investment in our truck fleet is an important component of our plan to meet our operational goals.
Revenue in the U-Move program could be adversely impacted should we fail to execute in any of these
areas. Even if we execute our plans, we could see declines in revenues primarily due to unforeseen
events including the continuation of adverse economic conditions or heightened competition that is
beyond our control.
With respect to our storage business, we have added new locations and expanded at existing
locations. In fiscal 2017, we are actively looking to acquire new locations, complete current projects and
increase occupancy in our existing portfolio of locations. New projects and acquisitions will be considered
and pursued if they fit our long-term plans and meet our financial objectives. We will continue to invest
capital and resources in the U-Box program throughout fiscal 2017.
Property and Casualty Insurance will continue to provide loss adjusting and claims handling for U-Haul
and underwrite components of the Safemove, Safetow, Safemove Plus, Safestor, and Safestor Mobile
protection packages to U-Haul customers.
Life Insurance is pursuing its goal of expanding its presence in the senior market through the sales of
its Medicare supplement, life and annuity policies. This strategy includes growing its agency force,
expanding its new product offerings, and pursuing business acquisition opportunities.
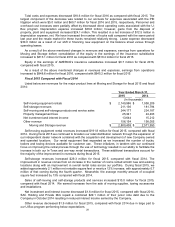
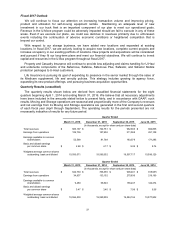
Quarterly Results (unaudited)
The quarterly results shown below are derived from unaudited financial statements for the eight
quarters beginning April 1, 2014 and ending March 31, 2016. We believe that all necessary adjustments
have been included in the amounts stated below to present fairly, and in accordance with GAAP, such
results. Moving and Storage operations are seasonal and proportionally more of the Company’s revenues
and net earnings from its Moving and Storage operations are generated in the first and second quarters
of each fiscal year (April through September). The operating results for the periods presented are not
necessarily indicative of results for any future period.
Quarter Ended
March 31, 2016
December 31, 2015
September 30, 2015
June 30, 2015
(In thousands, except for share and per share data)
Total revenues
$
683,197
$
744,751
$
962,903
$
884,805
Earnings from operations
106,736
157,902
311,068
291,108
Earnings available to common
shareholders
52,568
81,769
183,379
171,285
Basic and diluted earnings
per common share
$
2.68
$
4.17
$
9.36
$
8.74
Weighted average common shares
outstanding: basic and diluted
19,593,071
19,599,352
19,597,717
19,596,129
Quarter Ended
March 31, 2015
December 31, 2014
September 30, 2014
June 30, 2014
(In thousands, except for share and per share data)
Total revenues
$
642,730
$
706,355
$
906,491
$
818,955
Earnings from operations
34,837
133,152
275,836
219,199
Earnings available to common
shareholders
9,480
66,540
156,247
124,474
Basic and diluted earnings
per common share
$
0.47
$
3.40
$
7.98
$
6.36
Weighted average common shares
outstanding: basic and diluted
19,594,530
19,590,555
19,584,194
19,577,802