U-Haul 2016 Annual Report Download - page 111
Download and view the complete annual report
Please find page 111 of the 2016 U-Haul annual report below. You can navigate through the pages in the report by either clicking on the pages listed below, or by using the keyword search tool below to find specific information within the annual report.-
 1
1 -
2
-
3
-
4
-
5
-
6
-
7
-
8
-
9
-
10
-
11
-
12
-
13
-
14
-
15
-
16
-
17
-
18
-
19
-
20
-
21
-
22
-
23
-
24
-
25
-
26
-
27
-
28
-
29
-
30
-
31
-
32
-
33
-
34
-
35
-
36
-
37
-
38
-
39
-
40
-
41
-
42
-
43
-
44
-
45
-
46
-
47
-
48
-
49
-
50
-
51
-
52
-
53
-
54
-
55
-
56
-
57
-
58
-
59
-
60
-
61
-
62
-
63
-
64
-
65
-
66
-
67
-
68
-
69
-
70
-
71
-
72
-
73
-
74
-
75
-
76
-
77
-
78
-
79
-
80
-
81
-
82
-
83
-
84
-
85
-
86
-
87
-
88
-
89
-
90
-
91
-
92
-
93
-
94
-
95
-
96
-
97
-
98
-
99
-
100
-
 101
101 -
 102
102 -
 103
103 -
 104
104 -
 105
105 -
 106
106 -
 107
107 -
 108
108 -
 109
109 -
 110
110 -
 111
111 -
 112
112 -
 113
113 -
 114
114 -
 115
115 -
 116
116 -
 117
117 -
 118
118 -
 119
119 -
 120
120 -
 121
121 -
122
-
123
-
124
-
125
-
126
-
127
-
128
-
129
-
130
 |
 |

F-55
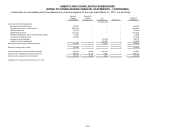
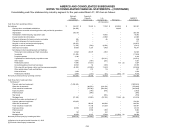
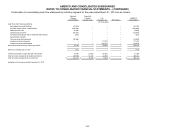
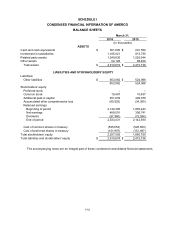
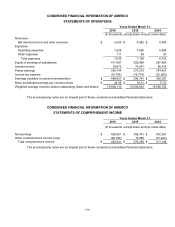
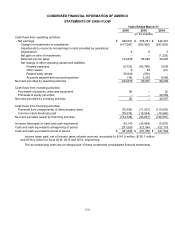
CONDENSED FINANCIAL INFORMATION OF AMERCO
STATEMENTS OF CASH FLOW
Years Ended March 31,
2016
2015
2014
(In thousands)
Cash flows from operating activities:
Net earnings
$
489,001
$
356,741
$
342,391
Change in investments in subsidiaries
(417,087)
(300,566)
(287,803)
Adjustments to reconcile net earnings to cash provided by operations:
Depreciation
6
6
5
Net gain on sale of investments
–
–
(1,325)
Deferred income taxes
124,838
66,628
34,605
Net change in other operating assets and liabilities:
Prepaid expenses
(8,723)
(66,786)
3,938
Other assets
6
84
(41)
Related party assets
56,849
(539)
–
Accounts payable and accrued expenses
(14)
5,239
6,589
Net cash provided by operating activities
244,876
60,807
98,359
Cash flows from investing activities:
Purchases of property, plant and equipment
(8)
–
(2)
Proceeds of equity securities
–
–
26,569
Net cash provided by investing activities
(8)
–
26,567
Cash flows from financing activities:
Proceeds from (repayments) of intercompany loans
(76,354)
(71,207)
(110,933)
Common stock dividends paid
(78,374)
(19,594)
(19,568)
Net cash provided (used) by financing activities
(154,728)
(90,801)
(130,501)
Increase (decrease) in cash and cash equivalents
90,140
(29,994)
(5,575)
Cash and cash equivalents at beginning of period
291,550
321,544
327,119
Cash and cash equivalents at end of period
$
381,690
$
291,550
$
321,544
Income taxes paid, net of income taxes refunds received, amounted to $141.9 million, $195.1 million
and $138.4 million for fiscal 2016, 2015 and 2014, respectively.
The accompanying notes are an integral part of these condensed consolidated financial statements.