U-Haul 2016 Annual Report Download - page 102
Download and view the complete annual report
Please find page 102 of the 2016 U-Haul annual report below. You can navigate through the pages in the report by either clicking on the pages listed below, or by using the keyword search tool below to find specific information within the annual report.-
 1
1 -
2
-
3
-
4
-
5
-
6
-
7
-
8
-
9
-
10
-
11
-
12
-
13
-
14
-
15
-
16
-
17
-
18
-
19
-
20
-
21
-
22
-
23
-
24
-
25
-
26
-
27
-
28
-
29
-
30
-
31
-
32
-
33
-
34
-
35
-
36
-
37
-
38
-
39
-
40
-
41
-
42
-
43
-
44
-
45
-
46
-
47
-
48
-
49
-
50
-
51
-
52
-
53
-
54
-
55
-
56
-
57
-
58
-
59
-
60
-
61
-
62
-
63
-
64
-
65
-
66
-
67
-
68
-
69
-
70
-
71
-
72
-
73
-
74
-
75
-
76
-
77
-
78
-
79
-
80
-
81
-
82
-
83
-
84
-
85
-
86
-
87
-
88
-
89
-
90
-
91
-
 92
92 -
 93
93 -
 94
94 -
 95
95 -
 96
96 -
 97
97 -
 98
98 -
 99
99 -
 100
100 -
 101
101 -
 102
102 -
 103
103 -
 104
104 -
 105
105 -
 106
106 -
 107
107 -
 108
108 -
 109
109 -
 110
110 -
 111
111 -
 112
112 -
113
-
114
-
115
-
116
-
117
-
118
-
119
-
120
-
121
-
122
-
123
-
124
-
125
-
126
-
127
-
128
-
129
-
130
 |
 |

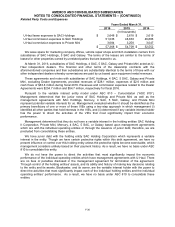
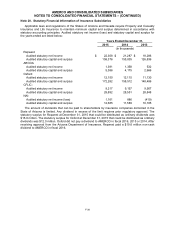
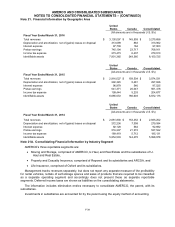
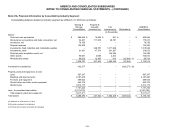
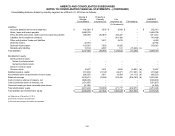
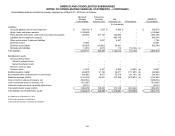
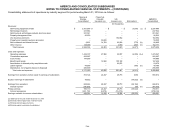
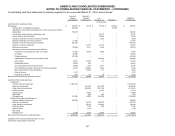
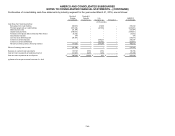
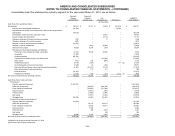
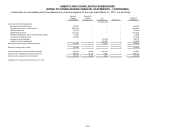
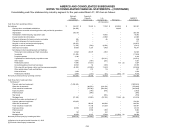
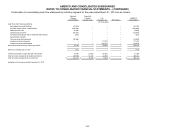
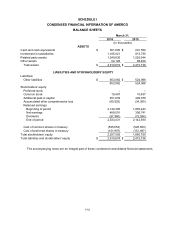
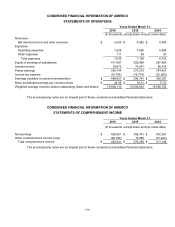
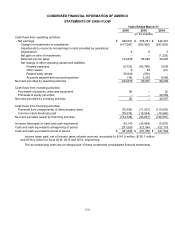
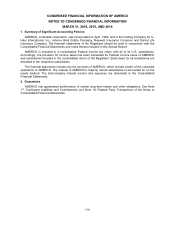
AMERCO AND CONSOLIDATED SUBSIDIARIES
NOTES TO CONSOLIDATED FINANCIAL STATEMENTS – (CONTINUED)
F-46
Consolidating statements of operations by industry segment for period ending March 31, 2014 are as follows:
Moving &
Storage
Consolidated
Property &
Casualty
Insurance (a)
Life
Insurance (a)
Eliminations
AMERCO
Consolidated
(In thousands)
Revenues:
Self-moving equipment rentals
$
1,958,209
$
–
$
–
$
(2,786)
(c)
$
1,955,423
Self-storage revenues
181,794
–
–
–
181,794
Self-moving & self-storage products & service sales
234,187
–
–
–
234,187
Property management fees
24,493
–
–
–
24,493
Life insurance premiums
–
–
157,919
–
157,919
Property and casualty insurance premiums
–
41,052
–
–
41,052
Net investment and interest income
15,212
10,592
54,398
(611)
(b)
79,591
Other revenue
158,055
–
3,211
(473)
(b)
160,793
Total revenues
2,571,950
51,644
215,528
(3,870)
2,835,252
Costs and expenses:
Operating expenses
1,272,406
20,799
23,686
(3,217)
(b,c)
1,313,674
Commission expenses
227,332
–
–
–
227,332
Cost of sales
127,270
–
–
–
127,270
Benefits and losses
–
11,513
145,189
–
156,702
Amortization of deferred policy acquisition costs
–
–
19,982
–
19,982
Lease expense
100,649
–
–
(183)
(b)
100,466
Depreciation, net of (gains) losses on disposals
259,612
–
–
–
259,612
Total costs and expenses
1,987,269
32,312
188,857
(3,400)
2,205,038
Earnings from operations before equity in earnings of subsidiaries
584,681
19,332
26,671
(470)
630,214
Equity in earnings of subsidiaries
29,992
–
–
(29,992)
(d)
–
Earnings from operations
614,673
19,332
26,671
(30,462)
630,214
Interest expense
(93,162)
–
–
470
(b)
(92,692)
Pretax earnings
521,511
19,332
26,671
(29,992)
537,522
Income tax expense
(179,120)
(6,670)
(9,341)
–
(195,131)
Earnings available to common shareholders
$
342,391
$
12,662
$
17,330
$
(29,992)
$
342,391
(a) Balances for the year ended December 31, 2013
(b) Eliminate intercompany lease/interest income
(c) Eliminate intercompany premiums
(d) Eliminate equity in earnings of subsidiaries