U-Haul 2016 Annual Report Download - page 36
Download and view the complete annual report
Please find page 36 of the 2016 U-Haul annual report below. You can navigate through the pages in the report by either clicking on the pages listed below, or by using the keyword search tool below to find specific information within the annual report.-
 1
1 -
2
-
3
-
4
-
5
-
6
-
7
-
8
-
9
-
10
-
11
-
12
-
13
-
14
-
15
-
16
-
17
-
18
-
19
-
20
-
21
-
22
-
23
-
24
-
25
-
 26
26 -
 27
27 -
 28
28 -
 29
29 -
 30
30 -
 31
31 -
 32
32 -
 33
33 -
 34
34 -
 35
35 -
 36
36 -
 37
37 -
 38
38 -
 39
39 -
 40
40 -
 41
41 -
 42
42 -
 43
43 -
 44
44 -
 45
45 -
 46
46 -
47
-
48
-
49
-
50
-
51
-
52
-
53
-
54
-
55
-
56
-
57
-
58
-
59
-
60
-
61
-
62
-
63
-
64
-
65
-
66
-
67
-
68
-
69
-
70
-
71
-
72
-
73
-
74
-
75
-
76
-
77
-
78
-
79
-
80
-
81
-
82
-
83
-
84
-
85
-
86
-
87
-
88
-
89
-
90
-
91
-
92
-
93
-
94
-
95
-
96
-
97
-
98
-
99
-
100
-
101
-
102
-
103
-
104
-
105
-
106
-
107
-
108
-
109
-
110
-
111
-
112
-
113
-
114
-
115
-
116
-
117
-
118
-
119
-
120
-
121
-
122
-
123
-
124
-
125
-
126
-
127
-
128
-
129
-
130
 |
 |
30
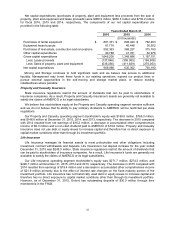
Net investment income was $12.8 million and $10.6 million for the years ended December 31, 2014
and 2013, respectively. The increase was due to a $0.3 million gain on disposals in 2014, $0.4 million in
real estate rental income and a $1.4 million increase in fixed maturity income due to an increase in
invested assets.
Net operating expenses were $24.8 million and $20.8 million for the years ended December 31, 2014
and 2013, respectively. The increase was primarily due to a $3.7 million increase in commission expense.
Benefits and losses incurred were $11.0 million and $11.5 million for the years ended December 31,
2014 and 2013, respectively.
As a result of the above mentioned changes in revenues and expenses, pretax earnings from
operations were $23.5 million and $19.3 million for the years ended December 31, 2014 and 2013,
respectively.
Life Insurance
2015 Compared with 2014
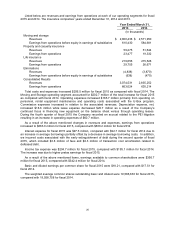
Net premiums were $162.7 million and $156.1 million for the years ended December 31, 2015 and
2014, respectively. Medicare supplement premiums increased $5.8 million from new sales offset by a
reduction in renewal premiums due to reduction in the in force business on older blocks. Medicare
supplement first year premiums were $16.9 million, an increase of $7.5 million over prior year. Life
premiums increased by $0.8 million primarily as a result of final expense renewals. Annuity deposits,
which are accounted for on the balance sheet as deposits rather than premiums, increased $195.8 million
over prior year. Included in the deposit increase is a $30.0 million deposit relating to a funding agreement
with Federal Home Loan Bank system (“FHLB”).
Net investment income was $64.0 million and $59.1 million for the years ended December 31, 2015
and 2014, respectively. Investment income increased $4.3 million due to a larger invested asset base
while $0.7 million came from realized gains from sales of investments.
Net operating expenses were $23.0 million and $22.5 million for the years ended December 31, 2015
and 2014, respectively. The moderate increase was primarily due to the increased administrative
expenses supporting new sales.
Benefits and losses incurred were $155.1 million and $147.8 million for the years ended December 31,
2015 and 2014, respectively. Medicare supplement benefits increased by $4.6 million primarily as a result
of the increase in incurred benefits from new sales partially offset by a decrease in Medicare supplement
active life reserve from the change in reserve valuation basis. Life insurance benefits increased $2.5
million due to higher mortality exposure while other benefits decreased $1.0 million. Interest credited to
policyholders increased $1.2 million reflecting the increase in annuity deposits.
Amortization of deferred acquisition costs (“DAC”), sales inducement asset (“SIA”) and the value of
business acquired (“VOBA”) was $23.3 million and $19.7 million for the years ended December 31, 2015
and 2014, respectively. The increase over prior year was a result of an increased amortization on annuity
and Medicare Supplement DAC due to the increased DAC asset base. This was partially offset by the
decrease in life amortization due to a prior year DAC balance write off on older blocks.
As a result of the above mentioned changes in revenues and expenses, pretax earnings from
operations were $29.8 million for both years ended December 31, 2015 and 2014.
Life Insurance
2014 Compared with 2013
Net premiums were $156.1 million and $157.9 million for the years ended December 31, 2014 and
2013, respectively. Medicare supplement premiums decreased by $2.4 million due to a reduction in the
in force business offset by new sales. Medicare Supplement first year premiums were $9.4 million, or a
$6.4 million increase above prior year. Other product lines experienced a $0.6 million increase. Annuity
deposits, which are accounted for on our balance sheet as deposits rather than premiums, decreased by
$16.9 million compared with the prior year.
Net investment income was $59.1 million and $54.4 million for the years ended December 31, 2014
and 2013, respectively. Investment income increased $3.8 million due to a larger invested asset base
while approximately $0.8 million came from realized gains.