U-Haul 2016 Annual Report Download - page 71
Download and view the complete annual report
Please find page 71 of the 2016 U-Haul annual report below. You can navigate through the pages in the report by either clicking on the pages listed below, or by using the keyword search tool below to find specific information within the annual report.-
 1
1 -
2
-
3
-
4
-
5
-
6
-
7
-
8
-
9
-
10
-
11
-
12
-
13
-
14
-
15
-
16
-
17
-
18
-
19
-
20
-
21
-
22
-
23
-
24
-
25
-
26
-
27
-
28
-
29
-
30
-
31
-
32
-
33
-
34
-
35
-
36
-
37
-
38
-
39
-
40
-
41
-
42
-
43
-
44
-
45
-
46
-
47
-
48
-
49
-
50
-
51
-
52
-
53
-
54
-
55
-
56
-
57
-
58
-
59
-
60
-
 61
61 -
 62
62 -
 63
63 -
 64
64 -
 65
65 -
 66
66 -
 67
67 -
 68
68 -
 69
69 -
 70
70 -
 71
71 -
 72
72 -
 73
73 -
 74
74 -
 75
75 -
 76
76 -
 77
77 -
 78
78 -
 79
79 -
 80
80 -
 81
81 -
82
-
83
-
84
-
85
-
86
-
87
-
88
-
89
-
90
-
91
-
92
-
93
-
94
-
95
-
96
-
97
-
98
-
99
-
100
-
101
-
102
-
103
-
104
-
105
-
106
-
107
-
108
-
109
-
110
-
111
-
112
-
113
-
114
-
115
-
116
-
117
-
118
-
119
-
120
-
121
-
122
-
123
-
124
-
125
-
126
-
127
-
128
-
129
-
130
 |
 |

AMERCO AND CONSOLIDATED SUBSIDIARIES
NOTES TO CONSOLIDATED FINANCIAL STATEMENTS – (CONTINUED)
F-15
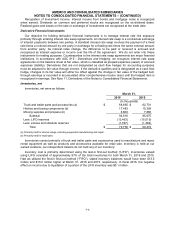
Available-for-Sale Investments
Available-for-sale investments at March 31, 2016 were as follows:
Amortized
Cost
Gross
Unrealized
Gains
Gross
Unrealized
Losses More
than 12
Months
Gross
Unrealized
Losses Less
than 12
Months
Estimated
Market
Value
(In thousands)
U.S. treasury securities and
government obligations
$
85,861
$
3,791
$
–
$
(193)
$
89,459
U.S. government agency mortgage-
backed securities
21,845
1,596
(6)
(39)
23,396
Obligations of states and political
subdivisions
166,725
10,660
(81)
(414)
176,890
Corporate securities
1,143,125
26,861
(8,013)
(28,181)
1,133,792
Mortgage-backed securities
42,991
475
–
(62)
43,404
Redeemable preferred stocks
17,977
556
–
(105)
18,428
Common stocks
17,732
7,822
(10)
(375)
25,169
$
1,496,256
$
51,761
$
(8,110)
$
(29,369)
$
1,510,538
Available-for-sale investments at March 31, 2015 were as follows:
Amortized
Cost
Gross
Unrealized
Gains
Gross
Unrealized
Losses More
than 12
Months
Gross
Unrealized
Losses Less
than 12
Months
Estimated
Market
Value
(In thousands)
U.S. treasury securities and
government obligations
$
99,722
$
5,658
$
(64)
$
–
$
105,316
U.S. government agency mortgage-
backed securities
30,569
2,614
(39)
(3)
33,141
Obligations of states and political
subdivisions
165,724
13,052
(298)
(10)
178,468
Corporate securities
885,470
44,426
(2,522)
(2,966)
924,408
Mortgage-backed securities
19,874
806
(1)
–
20,679
Redeemable preferred stocks
18,052
521
(253)
(24)
18,296
Common stocks
17,975
6,719
–
(40)
24,654
$
1,237,386
$
73,796
$
(3,177)
$
(3,043)
$
1,304,962
The available-for-sale tables include gross unrealized losses that are not deemed to be other-than-
temporarily impaired, aggregated by investment category and length of time that individual securities
have been in a continuous unrealized loss position.
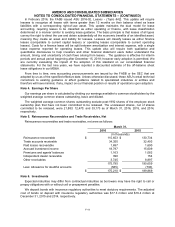
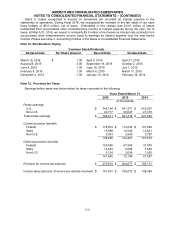
We sold available-for-sale securities with a fair value of $150.7 million, $109.1 million and $170.0
million in fiscal 2016, 2015 and 2014, respectively. The gross realized gains on these sales totaled $4.2
million, $4.6 million and $5.0 million in fiscal 2016, 2015 and 2014, respectively. We realized gross losses
on these sales of $0.6 million, $0.7 million and $1.4 million in fiscal 2016, 2015 and 2014, respectively.