U-Haul 2016 Annual Report Download - page 35
Download and view the complete annual report
Please find page 35 of the 2016 U-Haul annual report below. You can navigate through the pages in the report by either clicking on the pages listed below, or by using the keyword search tool below to find specific information within the annual report.-
 1
1 -
2
-
3
-
4
-
5
-
6
-
7
-
8
-
9
-
10
-
11
-
12
-
13
-
14
-
15
-
16
-
17
-
18
-
19
-
20
-
21
-
22
-
23
-
24
-
 25
25 -
 26
26 -
 27
27 -
 28
28 -
 29
29 -
 30
30 -
 31
31 -
 32
32 -
 33
33 -
 34
34 -
 35
35 -
 36
36 -
 37
37 -
 38
38 -
 39
39 -
 40
40 -
 41
41 -
 42
42 -
 43
43 -
 44
44 -
 45
45 -
46
-
47
-
48
-
49
-
50
-
51
-
52
-
53
-
54
-
55
-
56
-
57
-
58
-
59
-
60
-
61
-
62
-
63
-
64
-
65
-
66
-
67
-
68
-
69
-
70
-
71
-
72
-
73
-
74
-
75
-
76
-
77
-
78
-
79
-
80
-
81
-
82
-
83
-
84
-
85
-
86
-
87
-
88
-
89
-
90
-
91
-
92
-
93
-
94
-
95
-
96
-
97
-
98
-
99
-
100
-
101
-
102
-
103
-
104
-
105
-
106
-
107
-
108
-
109
-
110
-
111
-
112
-
113
-
114
-
115
-
116
-
117
-
118
-
119
-
120
-
121
-
122
-
123
-
124
-
125
-
126
-
127
-
128
-
129
-
130
 |
 |

29
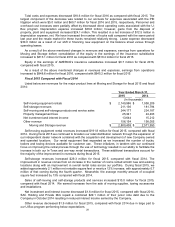
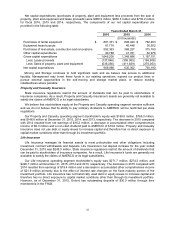
The Company owns and manages self-storage facilities. Self-storage revenues reported in the
consolidated financial statements represent Company-owned locations only. Self-storage data for our
owned storage locations follows:
Year Ended March 31,
2015
2014
(In thousands, except occupancy rate)
Room count as of March 31
232
207
Square footage as of March 31
20,318
18,164
Average monthly number of rooms occupied
180
160
Average monthly occupancy rate based on room count
81.7%
80.5%
Average monthly square footage occupied
16,021
14,148
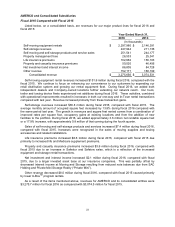
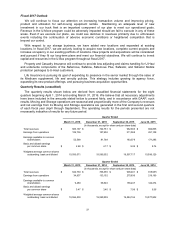
Total costs and expenses increased $202.7 million for fiscal 2015 as compared with fiscal 2014.
Operating expenses increased $163.7 million primarily from spending on personnel, rental equipment
maintenance and operating costs associated with the U-Box program. Commission expenses increased
in relation to the associated revenues. Depreciation expense increased $59.6 million and gains from the
disposal of property, plant and equipment increased by $41.1 million. Lease expense decreased $20.7
million as a result of the Company’s continued focus towards financing new equipment on the balance
sheet versus through operating leases. During the fourth quarter of fiscal 2015 the Company recorded an
accrual related to the PEI litigation resulting in an increase in operating expenses of $60.7 million.
As a result of the above mentioned changes in revenues and expenses, earnings from operations for
Moving and Storage before consolidation of the equity in the earnings of the insurance subsidiaries
increased to $610.4 million for fiscal 2015 as compared with $584.7 million for fiscal 2014.
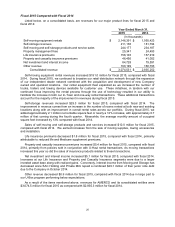
Equity in the earnings of AMERCO’s insurance subsidiaries increased $4.8 million for fiscal 2015,
compared with fiscal 2014.
As a result of the above mentioned changes in revenues and expenses, earnings from operations
increased to $645.2 million for fiscal 2015, compared with $614.7 million for fiscal 2014.
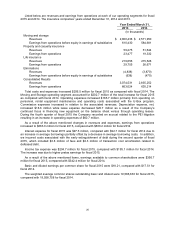
Property and Casualty Insurance
2015 Compared with 2014
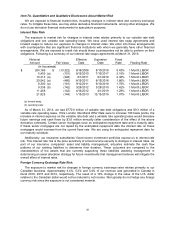
Net premiums were $50.0 million and $46.5 million for the years ended December 31, 2015 and 2014,
respectively. A significant portion of Repwest’s premiums are from policies sold in conjunction with U-Haul
rental transactions. The premium growth corresponded with the increased moving and storage
transactions at U-Haul.
Net investment income was $14.8 million and $12.8 million for the years ended December 31, 2015
and 2014, respectively. The increase came from the real estate and fixed maturity portfolios that both
grew in size compared to 2014.
Net operating expenses were $28.0 million and $24.8 million for the years ended December 31, 2015
and 2014, respectively. The increase was due largely to additional commission expenses and higher loss
adjusting expenses.
Benefits and losses incurred were $12.3 million and $11.0 million for the years ended December 31,
2015 and 2014, respectively. The increase was due to claims activity coming from additional new
business.
As a result of the above mentioned changes in revenues and expenses, pretax earnings from
operations were $24.5 million and $23.5 million for the years ended December 31, 2015 and 2014,
respectively.
Property and Casualty Insurance
2014 Compared with 2013
Net premiums were $46.5 million and $41.1 million for the years ended December 31, 2014 and 2013,
respectively. A significant portion of Repwest’s premiums are from policies sold in conjunction with U-Haul
rental transactions. The premium growth corresponded with the increased moving and storage
transactions at U-Haul.