U-Haul 2016 Annual Report Download - page 72
Download and view the complete annual report
Please find page 72 of the 2016 U-Haul annual report below. You can navigate through the pages in the report by either clicking on the pages listed below, or by using the keyword search tool below to find specific information within the annual report.-
 1
1 -
2
-
3
-
4
-
5
-
6
-
7
-
8
-
9
-
10
-
11
-
12
-
13
-
14
-
15
-
16
-
17
-
18
-
19
-
20
-
21
-
22
-
23
-
24
-
25
-
26
-
27
-
28
-
29
-
30
-
31
-
32
-
33
-
34
-
35
-
36
-
37
-
38
-
39
-
40
-
41
-
42
-
43
-
44
-
45
-
46
-
47
-
48
-
49
-
50
-
51
-
52
-
53
-
54
-
55
-
56
-
57
-
58
-
59
-
60
-
61
-
 62
62 -
 63
63 -
 64
64 -
 65
65 -
 66
66 -
 67
67 -
 68
68 -
 69
69 -
 70
70 -
 71
71 -
 72
72 -
 73
73 -
 74
74 -
 75
75 -
 76
76 -
 77
77 -
 78
78 -
 79
79 -
 80
80 -
 81
81 -
 82
82 -
83
-
84
-
85
-
86
-
87
-
88
-
89
-
90
-
91
-
92
-
93
-
94
-
95
-
96
-
97
-
98
-
99
-
100
-
101
-
102
-
103
-
104
-
105
-
106
-
107
-
108
-
109
-
110
-
111
-
112
-
113
-
114
-
115
-
116
-
117
-
118
-
119
-
120
-
121
-
122
-
123
-
124
-
125
-
126
-
127
-
128
-
129
-
130
 |
 |

AMERCO AND CONSOLIDATED SUBSIDIARIES
NOTES TO CONSOLIDATED FINANCIAL STATEMENTS – (CONTINUED)
F-16
The unrealized losses of more than twelve months in the available-for-sale tables are considered
temporary declines. We track each investment with an unrealized loss and evaluate them on an individual
basis for other-than-temporary impairments including obtaining corroborating opinions from third party
sources, performing trend analysis and reviewing management’s future plans. Certain of these
investments may have declines determined by management to be other-than-temporary and we
recognized these write-downs through earnings. There were no write downs in fiscal 2016, 2015 and
2014.
The investment portfolio primarily consists of corporate securities and U.S. government securities. We
believe we monitor our investments as appropriate. Our methodology of assessing other-than-temporary
impairments is based on security-specific analysis as of the balance sheet date and considers various
factors, including the length of time to maturity, the extent to which the fair value has been less than the
cost, the financial condition and the near-term prospects of the issuer, and whether the debtor is current
on its contractually obligated interest and principal payments. Nothing has come to management’s
attention that would lead to the belief that each issuer would not have the ability to meet the remaining
contractual obligations of the security, including payment at maturity. We have the ability and intent not to
sell our fixed maturity and common stock investments for a period of time sufficient to allow us to recover
our costs.
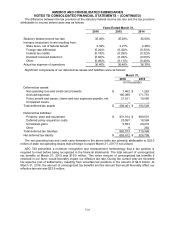
The portion of other-than-temporary impairment related to a credit loss is recognized in earnings. The
significant inputs utilized in the evaluation of mortgage backed securities credit losses include ratings,
delinquency rates, and prepayment activity. The significant inputs utilized in the evaluation of asset
backed securities credit losses include the time frame for principal recovery and the subordination and
value of the underlying collateral.
There were no credit losses recognized in earnings for which a portion of an other-than-temporary
impairment was recognized in accumulated other comprehensive loss for fiscal 2016 or 2015.
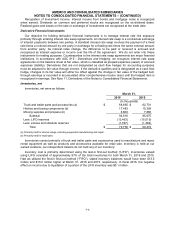
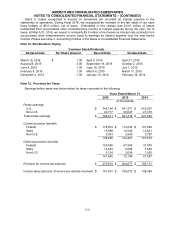
The adjusted cost and estimated market value of available-for-sale investments by contractual
maturity, were as follows:
March 31, 2016
March 31, 2015
Amortized
Cost
Estimated
Market
Value
Amortized
Cost
Estimated
Market
Value
(In thousands)
Due in one year or less
$
48,679
$
49,146
$
36,355
$
37,055
Due after one year through five years
250,576
256,597
198,488
209,404
Due after five years through ten years
557,984
557,961
474,639
492,782
Due after ten years
560,317
559,833
472,003
502,092
1,417,556
1,423,537
1,181,485
1,241,333
Mortgage backed securities
42,991
43,404
19,874
20,679
Redeemable preferred stocks
17,977
18,428
18,052
18,296
Equity securities
17,732
25,169
17,975
24,654
$
1,496,256
$
1,510,538
$
1,237,386
$
1,304,962