U-Haul 2016 Annual Report Download - page 39
Download and view the complete annual report
Please find page 39 of the 2016 U-Haul annual report below. You can navigate through the pages in the report by either clicking on the pages listed below, or by using the keyword search tool below to find specific information within the annual report.-
 1
1 -
2
-
3
-
4
-
5
-
6
-
7
-
8
-
9
-
10
-
11
-
12
-
13
-
14
-
15
-
16
-
17
-
18
-
19
-
20
-
21
-
22
-
23
-
24
-
25
-
26
-
27
-
28
-
 29
29 -
 30
30 -
 31
31 -
 32
32 -
 33
33 -
 34
34 -
 35
35 -
 36
36 -
 37
37 -
 38
38 -
 39
39 -
 40
40 -
 41
41 -
 42
42 -
 43
43 -
 44
44 -
 45
45 -
 46
46 -
 47
47 -
 48
48 -
 49
49 -
50
-
51
-
52
-
53
-
54
-
55
-
56
-
57
-
58
-
59
-
60
-
61
-
62
-
63
-
64
-
65
-
66
-
67
-
68
-
69
-
70
-
71
-
72
-
73
-
74
-
75
-
76
-
77
-
78
-
79
-
80
-
81
-
82
-
83
-
84
-
85
-
86
-
87
-
88
-
89
-
90
-
91
-
92
-
93
-
94
-
95
-
96
-
97
-
98
-
99
-
100
-
101
-
102
-
103
-
104
-
105
-
106
-
107
-
108
-
109
-
110
-
111
-
112
-
113
-
114
-
115
-
116
-
117
-
118
-
119
-
120
-
121
-
122
-
123
-
124
-
125
-
126
-
127
-
128
-
129
-
130
 |
 |

33
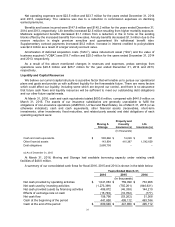
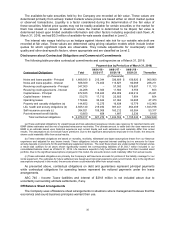
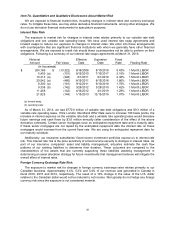
Net capital expenditures (purchases of property, plant and equipment less proceeds from the sale of
property, plant and equipment and lease proceeds) were $969.9 million, $630.3 million and $730.2 million
for fiscal 2016, 2015 and 2014, respectively. The components of our net capital expenditures are
provided in the following table:
Years Ended March 31,
2016
2015
2014
(In thousands)
Purchases of rental equipment
$
881,331
$
898,420
$
782,463
Equipment lease buyouts
81,718
40,448
36,552
Purchases of real estate, construction and renovations
592,363
368,257
315,160
Other capital expenditures
90,788
41,761
62,976
Gross capital expenditures
1,646,200
1,348,886
1,197,151
Less: Lease proceeds
(137,046)
(306,955)
(196,908)
Less: Sales of property, plant and equipment
(539,256)
(411,629)
(270,053)
Net capital expenditures
969,898
630,302
730,190
Moving and Storage continues to hold significant cash and we believe has access to additional
liquidity. Management may invest these funds in our existing operations, expand our product lines or
pursue external opportunities in the self-moving and storage market place, or reduce existing
indebtedness where possible.
Property and Casualty Insurance
State insurance regulations restrict the amount of dividends that can be paid to stockholders of
insurance companies. As a result, Property and Casualty Insurance's assets are generally not available to
satisfy the claims of AMERCO or its legal subsidiaries.
We believe that stockholders equity at the Property and Casualty operating segment remains sufficient
and we do not believe that its ability to pay ordinary dividends to AMERCO will be restricted per state
regulations.
Our Property and Casualty operating segment stockholder’s equity was $160.6 million, $169.3 million,
and $146.8 million at December 31, 2015, 2014, and 2013, respectively. The decrease in 2015 compared
with 2014 resulted from net earnings of $16.2 million, a decrease in accumulated other comprehensive
income of $5.3 million and a non-cash dividend paid to AMERCO of $19.6 million. Property and Casualty
Insurance does not use debt or equity issues to increase capital and therefore has no direct exposure to
capital market conditions other than through its investment portfolio.
Life Insurance
Life Insurance manages its financial assets to meet policyholder and other obligations including
investment contract withdrawals and deposits. Life Insurance's net deposit increase for the year ended
December 31, 2015 was $245.3 million. State insurance regulations restrict the amount of dividends that
can be paid to stockholders of insurance companies. As a result, Life Insurance's funds are generally not
available to satisfy the claims of AMERCO or its legal subsidiaries.
Our Life Insurance operating segment stockholder’s equity was $271.7 million, $274.2 million, and
$226.7 million at December 31, 2015, 2014 and 2013, respectively. The decrease in 2015 compared with
2014 resulted from earnings of $19.4 million and a decrease in accumulated other comprehensive income
of $21.9 million primarily due to the effect of interest rate changes on the fixed maturity portion of the
investment portfolio. Life Insurance has not historically used debt or equity issues to increase capital and
therefore has no direct exposure to capital market conditions other than through its investment portfolio.
However, as of December 31, 2015, Oxford has outstanding deposits of $30.0 million through their
membership in the FHLB.