Time Warner Cable 2008 Annual Report Download - page 99
Download and view the complete annual report
Please find page 99 of the 2008 Time Warner Cable annual report below. You can navigate through the pages in the report by either clicking on the pages listed below, or by using the keyword search tool below to find specific information within the annual report.-
 1
1 -
2
-
3
-
4
-
5
-
6
-
7
-
8
-
9
-
10
-
11
-
12
-
13
-
14
-
15
-
16
-
17
-
18
-
19
-
20
-
21
-
22
-
23
-
24
-
25
-
26
-
27
-
28
-
29
-
30
-
31
-
32
-
33
-
34
-
35
-
36
-
37
-
38
-
39
-
40
-
41
-
42
-
43
-
44
-
45
-
46
-
47
-
48
-
49
-
50
-
51
-
52
-
53
-
54
-
55
-
56
-
57
-
58
-
59
-
60
-
61
-
62
-
63
-
64
-
65
-
66
-
67
-
68
-
69
-
70
-
71
-
72
-
73
-
74
-
75
-
76
-
77
-
78
-
79
-
80
-
81
-
82
-
83
-
84
-
85
-
86
-
87
-
88
-
 89
89 -
 90
90 -
 91
91 -
 92
92 -
 93
93 -
 94
94 -
 95
95 -
 96
96 -
 97
97 -
 98
98 -
 99
99 -
 100
100 -
 101
101 -
 102
102 -
 103
103 -
 104
104 -
 105
105 -
 106
106 -
 107
107 -
 108
108 -
 109
109 -
110
-
111
-
112
-
113
-
114
-
115
-
116
-
117
-
118
-
119
-
120
-
121
-
122
-
123
-
124
-
125
-
126
-
127
-
128
-
129
-
130
-
131
-
132
-
133
-
134
-
135
-
136
-
137
-
138
-
139
-
140
-
141
-
142
-
143
-
144
-
145
-
146
-
147
-
148
-
149
-
150
-
151
-
152
-
153
-
154
-
155
-
156
-
157
-
158
-
159
-
160
-
161
-
162
-
163
-
164
-
165
-
166
-
167
-
168
-
169
-
170
-
171
-
172
 |
 |

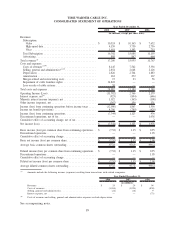
TIME WARNER CABLE INC.
CONSOLIDATED STATEMENT OF OPERATIONS
2008 2007 2006
Year Ended December 31,
(in millions, except per share data)
Revenues:
Subscription:
Video . . . . . . . . . . . . . . . . . . . . . . . . . . . . . . . . . . . . . . . . . $ 10,524 $ 10,165 $ 7,632
High-speed data . . . . . . . . . . . . . . . . . . . . . . . . . . . . . . . . . . 4,159 3,730 2,756
Voice . . . . . . . . . . . . . . . . . . . . . . . . . . . . . . . . . . . . . . . . . 1,619 1,193 715
Total Subscription . . . . . . . . . . . . . . . . . . . . . . . . . . . . . . . . . . 16,302 15,088 11,103
Advertising . . . . . . . . . . . . . . . . . . . . . . . . . . . . . . . . . . . . . . . 898 867 664
Total revenues
(a)
. . . . . . . . . . . . . . . . . . . . . . . . . . . . . . . . . . . . . 17,200 15,955 11,767
Costs and expenses:
Costs of revenues
(a)(b)
. . . . . . . . . . . . . . . . . . . . . . . . . . . . . . . . 8,145 7,542 5,356
Selling, general and administrative
(a)(b)
. . . . . . . . . . . . . . . . . . . . 2,854 2,648 2,126
Depreciation . . . . . . . . . . . . . . . . . . . . . . . . . . . . . . . . . . . . . . 2,826 2,704 1,883
Amortization . . . . . . . . . . . . . . . . . . . . . . . . . . . . . . . . . . . . . . 262 272 167
Merger-related and restructuring costs . . . . . . . . . . . . . . . . . . . . 15 23 56
Impairment of cable franchise rights . . . . . . . . . . . . . . . . . . . . . 14,822 — —
Loss on sale of cable systems . . . . . . . . . . . . . . . . . . . . . . . . . . 58 — —
Total costs and expenses . . . . . . . . . . . . . . . . . . . . . . . . . . . . . . . 28,982 13,189 9,588
Operating Income (Loss) . . . . . . . . . . . . . . . . . . . . . . . . . . . . . . . (11,782) 2,766 2,179
Interest expense, net
(a)
. . . . . . . . . . . . . . . . . . . . . . . . . . . . . . . . . (923) (894) (646)
Minority interest income (expense), net . . . . . . . . . . . . . . . . . . . . . 1,022 (165) (108)
Other income (expense), net . . . . . . . . . . . . . . . . . . . . . . . . . . . . . (367) 156 131
Income (loss) from continuing operations before income taxes . . . . . (12,050) 1,863 1,556
Income tax benefit (provision) . . . . . . . . . . . . . . . . . . . . . . . . . . . 4,706 (740) (620)
Income (loss) from continuing operations . . . . . . . . . . . . . . . . . . . . (7,344) 1,123 936
Discontinued operations, net of tax . . . . . . . . . . . . . . . . . . . . . . . . — — 1,038
Cumulative effect of accounting change, net of tax . . . . . . . . . . . . . — — 2
Net income (loss) . . . . . . . . . . . . . . . . . . . . . . . . . . . . . . . . . . . . $ (7,344) $ 1,123 $ 1,976
Basic income (loss) per common share from continuing operations . . $ (7.52) $ 1.15 $ 0.95
Discontinued operations . . . . . . . . . . . . . . . . . . . . . . . . . . . . . . . . — — 1.05
Cumulative effect of accounting change . . . . . . . . . . . . . . . . . . . . . — — —
Basic net income (loss) per common share . . . . . . . . . . . . . . . . . . . $ (7.52) $ 1.15 $ 2.00
Average basic common shares outstanding . . . . . . . . . . . . . . . . . . . 977.0 976.9 990.4
Diluted income (loss) per common share from continuing operations. . $ (7.52) $ 1.15 $ 0.95
Discontinued operations . . . . . . . . . . . . . . . . . . . . . . . . . . . . . . . . — — 1.05
Cumulative effect of accounting change . . . . . . . . . . . . . . . . . . . . . — — —
Diluted net income (loss) per common share . . . . . . . . . . . . . . . . . $ (7.52) $ 1.15 $ 2.00
Average diluted common shares outstanding . . . . . . . . . . . . . . . . . . 977.0 977.2 990.4
(a)
Amounts include the following income (expenses) resulting from transactions with related companies:
2008 2007 2006
Year Ended December 31,
(in millions)
Revenues ......................................... $ 29 $ 20 $ 94
Costs of revenues .................................... (1,054) (1,024) (830)
Selling, general and administrative ......................... (22) (16) 9
Interest expense, net . . . ............................... — — (73)
(b)
Costs of revenues and selling, general and administrative expenses exclude depreciation.
See accompanying notes.
89