Time Warner Cable 2008 Annual Report Download - page 151
Download and view the complete annual report
Please find page 151 of the 2008 Time Warner Cable annual report below. You can navigate through the pages in the report by either clicking on the pages listed below, or by using the keyword search tool below to find specific information within the annual report.-
 1
1 -
2
-
3
-
4
-
5
-
6
-
7
-
8
-
9
-
10
-
11
-
12
-
13
-
14
-
15
-
16
-
17
-
18
-
19
-
20
-
21
-
22
-
23
-
24
-
25
-
26
-
27
-
28
-
29
-
30
-
31
-
32
-
33
-
34
-
35
-
36
-
37
-
38
-
39
-
40
-
41
-
42
-
43
-
44
-
45
-
46
-
47
-
48
-
49
-
50
-
51
-
52
-
53
-
54
-
55
-
56
-
57
-
58
-
59
-
60
-
61
-
62
-
63
-
64
-
65
-
66
-
67
-
68
-
69
-
70
-
71
-
72
-
73
-
74
-
75
-
76
-
77
-
78
-
79
-
80
-
81
-
82
-
83
-
84
-
85
-
86
-
87
-
88
-
89
-
90
-
91
-
92
-
93
-
94
-
95
-
96
-
97
-
98
-
99
-
100
-
101
-
102
-
103
-
104
-
105
-
106
-
107
-
108
-
109
-
110
-
111
-
112
-
113
-
114
-
115
-
116
-
117
-
118
-
119
-
120
-
121
-
122
-
123
-
124
-
125
-
126
-
127
-
128
-
129
-
130
-
131
-
132
-
133
-
134
-
135
-
136
-
137
-
138
-
139
-
140
-
 141
141 -
 142
142 -
 143
143 -
 144
144 -
 145
145 -
 146
146 -
 147
147 -
 148
148 -
 149
149 -
 150
150 -
 151
151 -
 152
152 -
 153
153 -
 154
154 -
 155
155 -
 156
156 -
 157
157 -
 158
158 -
 159
159 -
 160
160 -
 161
161 -
162
-
163
-
164
-
165
-
166
-
167
-
168
-
169
-
170
-
171
-
172
 |
 |

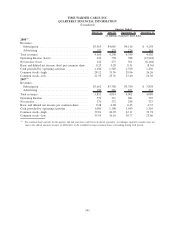
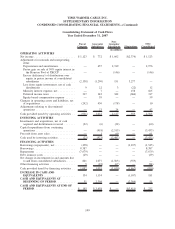
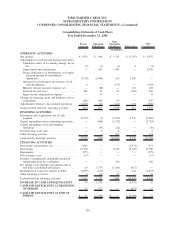
TIME WARNER CABLE INC.
QUARTERLY FINANCIAL INFORMATION
(Unaudited)
March 31, June 30, September, 30 December 31,
Quarters Ended
(in millions, except per share data)
2008
(a)
Revenues:
Subscription .............................. $3,963 $4,065 $4,116 $ 4,158
Advertising ............................... 197 233 224 244
Total revenues ............................... 4,160 4,298 4,340 4,402
Operating Income (Loss) . ...................... 636 738 788 (13,944)
Net income (loss) ............................ 242 277 301 (8,164)
Basic and diluted net income (loss) per common share. . 0.25 0.28 0.31 (8.36)
Cash provided by operating activities .............. 1,186 1,349 1,329 1,436
Common stock—high . . . ...................... 28.12 31.56 29.96 26.26
Common stock—low .......................... 21.95 25.31 23.40 16.30
2007
(a)
Revenues:
Subscription .............................. $3,662 $3,788 $3,780 $ 3,858
Advertising ............................... 189 226 221 231
Total revenues ............................... 3,851 4,014 4,001 4,089
Operating Income ............................ 579 711 681 795
Net income ................................. 276 272 248 327
Basic and diluted net income per common share ..... 0.28 0.28 0.25 0.33
Cash provided by operating activities .............. 1,006 1,198 1,049 1,310
Common stock—high . . . ...................... 39.01 40.03 42.11 33.74
Common stock—low .......................... 35.93 36.10 30.77 23.60
(a)
Per common share amounts for the quarters and full years have each been calculated separately. Accordingly, quarterly amounts may not
sum to the annual amounts because of differences in the weighted-average common shares outstanding during each period.
141