Time Warner Cable 2008 Annual Report Download - page 74
Download and view the complete annual report
Please find page 74 of the 2008 Time Warner Cable annual report below. You can navigate through the pages in the report by either clicking on the pages listed below, or by using the keyword search tool below to find specific information within the annual report.-
 1
1 -
2
-
3
-
4
-
5
-
6
-
7
-
8
-
9
-
10
-
11
-
12
-
13
-
14
-
15
-
16
-
17
-
18
-
19
-
20
-
21
-
22
-
23
-
24
-
25
-
26
-
27
-
28
-
29
-
30
-
31
-
32
-
33
-
34
-
35
-
36
-
37
-
38
-
39
-
40
-
41
-
42
-
43
-
44
-
45
-
46
-
47
-
48
-
49
-
50
-
51
-
52
-
53
-
54
-
55
-
56
-
57
-
58
-
59
-
60
-
61
-
62
-
63
-
 64
64 -
 65
65 -
 66
66 -
 67
67 -
 68
68 -
 69
69 -
 70
70 -
 71
71 -
 72
72 -
 73
73 -
 74
74 -
 75
75 -
 76
76 -
 77
77 -
 78
78 -
 79
79 -
 80
80 -
 81
81 -
 82
82 -
 83
83 -
 84
84 -
85
-
86
-
87
-
88
-
89
-
90
-
91
-
92
-
93
-
94
-
95
-
96
-
97
-
98
-
99
-
100
-
101
-
102
-
103
-
104
-
105
-
106
-
107
-
108
-
109
-
110
-
111
-
112
-
113
-
114
-
115
-
116
-
117
-
118
-
119
-
120
-
121
-
122
-
123
-
124
-
125
-
126
-
127
-
128
-
129
-
130
-
131
-
132
-
133
-
134
-
135
-
136
-
137
-
138
-
139
-
140
-
141
-
142
-
143
-
144
-
145
-
146
-
147
-
148
-
149
-
150
-
151
-
152
-
153
-
154
-
155
-
156
-
157
-
158
-
159
-
160
-
161
-
162
-
163
-
164
-
165
-
166
-
167
-
168
-
169
-
170
-
171
-
172
 |
 |

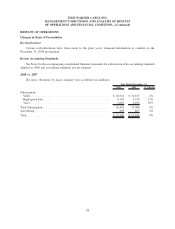
Revenues. Revenues by major category were as follows (in millions):
2007 2006 % Change
Year Ended December 31,
Subscription:
Video ................................................. $ 10,165 $ 7,632 33%
High-speed data ......................................... 3,730 2,756 35%
Voice ................................................. 1,193 715 67%
Total Subscription .......................................... 15,088 11,103 36%
Advertising ............................................... 867 664 31%
Total.................................................... $ 15,955 $ 11,767 36%
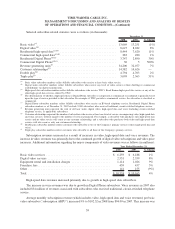
Revenues by major category for the Legacy Systems, the Acquired Systems, the Kansas City Pool and the total
systems were as follows (in millions):
Legacy
Systems
Acquired
Systems
Kansas
City Pool
Total
Systems
Legacy
Systems
Acquired
Systems
(a)
Total
Systems
Year Ended December 31, 2007 Year Ended December 31, 2006
Subscription:
Video .............. $ 6,830 $ 2,788 $ 547 $ 10,165 $ 6,467 $ 1,165 $ 7,632
High-speed data ....... 2,692 835 203 3,730 2,435 321 2,756
Voice .............. 1,011 97 85 1,193 687 28 715
Total Subscription ....... 10,533 3,720 835 15,088 9,589 1,514 11,103
Advertising ............ 539 286 42 867 527 137 664
Total ................. $ 11,072 $ 4,006 $ 877 $ 15,955 $ 10,116 $ 1,651 $ 11,767
(a)
Amounts reflect revenues for the Acquired Systems for the five months following the closing of the Adelphia/Comcast Transactions.
64
TIME WARNER CABLE INC.
MANAGEMENT’S DISCUSSION AND ANALYSIS OF RESULTS
OF OPERATIONS AND FINANCIAL CONDITION—(Continued)