Time Warner Cable 2008 Annual Report Download - page 100
Download and view the complete annual report
Please find page 100 of the 2008 Time Warner Cable annual report below. You can navigate through the pages in the report by either clicking on the pages listed below, or by using the keyword search tool below to find specific information within the annual report.-
 1
1 -
2
-
3
-
4
-
5
-
6
-
7
-
8
-
9
-
10
-
11
-
12
-
13
-
14
-
15
-
16
-
17
-
18
-
19
-
20
-
21
-
22
-
23
-
24
-
25
-
26
-
27
-
28
-
29
-
30
-
31
-
32
-
33
-
34
-
35
-
36
-
37
-
38
-
39
-
40
-
41
-
42
-
43
-
44
-
45
-
46
-
47
-
48
-
49
-
50
-
51
-
52
-
53
-
54
-
55
-
56
-
57
-
58
-
59
-
60
-
61
-
62
-
63
-
64
-
65
-
66
-
67
-
68
-
69
-
70
-
71
-
72
-
73
-
74
-
75
-
76
-
77
-
78
-
79
-
80
-
81
-
82
-
83
-
84
-
85
-
86
-
87
-
88
-
89
-
 90
90 -
 91
91 -
 92
92 -
 93
93 -
 94
94 -
 95
95 -
 96
96 -
 97
97 -
 98
98 -
 99
99 -
 100
100 -
 101
101 -
 102
102 -
 103
103 -
 104
104 -
 105
105 -
 106
106 -
 107
107 -
 108
108 -
 109
109 -
 110
110 -
111
-
112
-
113
-
114
-
115
-
116
-
117
-
118
-
119
-
120
-
121
-
122
-
123
-
124
-
125
-
126
-
127
-
128
-
129
-
130
-
131
-
132
-
133
-
134
-
135
-
136
-
137
-
138
-
139
-
140
-
141
-
142
-
143
-
144
-
145
-
146
-
147
-
148
-
149
-
150
-
151
-
152
-
153
-
154
-
155
-
156
-
157
-
158
-
159
-
160
-
161
-
162
-
163
-
164
-
165
-
166
-
167
-
168
-
169
-
170
-
171
-
172
 |
 |

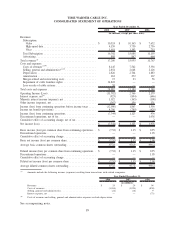
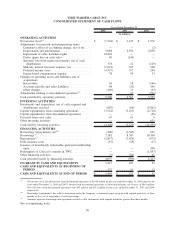
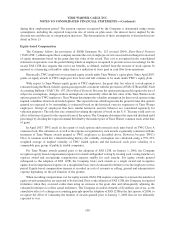
TIME WARNER CABLE INC.
CONSOLIDATED STATEMENT OF CASH FLOWS
2008 2007 2006
Year Ended December 31,
(in millions)
OPERATING ACTIVITIES
Net income (loss)
(a)
............................. $ (7,344) $ 1,123 $ 1,976
Adjustments for noncash and nonoperating items:
Cumulative effect of accounting change, net of tax .... — — (2)
Depreciation and amortization ................... 3,088 2,976 2,050
Impairment of cable franchise rights ............... 14,822 — —
Pretax (gain) loss on asset sales .................. 49 (146) —
(Income) loss from equity investments, net of cash
distributions ............................... 378 12 (129)
Minority interest (income) expense, net ............ (1,022) 165 108
Deferred income taxes ......................... (4,557) 317 240
Equity-based compensation expense ............... 78 59 33
Changes in operating assets and liabilities, net of
acquisitions:
Receivables ................................. 20 18 (146)
Accounts payable and other liabilities .............. 48 (29) 456
Other changes ............................... (260) 21 (65)
Adjustments relating to discontinued operations
(a)
....... — 47 (926)
Cash provided by operating activities ................ 5,300 4,563 3,595
INVESTING ACTIVITIES
Investments and acquisitions, net of cash acquired and
distributions received .......................... (685) (60) (9,862)
Capital expenditures from continuing operations ........ (3,522) (3,433) (2,718)
Capital expenditures from discontinued operations ...... — — (56)
Proceeds from asset sales ......................... 67 61 6
Other investing activities ......................... — — 631
Cash used by investing activities ................... (4,140) (3,432) (11,999)
FINANCING ACTIVITIES
Borrowings (repayments), net
(b)
.................... (206) (1,545) 651
Borrowings
(c)
.................................. 7,182 8,387 10,300
Repayments
(c)
................................. (2,817) (7,679) (975)
Debt issuance costs ............................. (97) (29) (17)
Issuance of mandatorily redeemable preferred membership
units ...................................... — — 300
Redemption of Comcast’s interest in TWC ............ — — (1,857)
Other financing activities ......................... (5) (84) 41
Cash provided (used) by financing activities ........... 4,057 (950) 8,443
INCREASE IN CASH AND EQUIVALENTS ........ 5,217 181 39
CASH AND EQUIVALENTS AT BEGINNING OF
PERIOD ................................... 232 51 12
CASH AND EQUIVALENTS AT END OF PERIOD . . $ 5,449 $ 232 $ 51
(a)
Net income (loss) included income from discontinued operations of $1.038 billion for the year ended December 31, 2006 (none for the
years ended December 31, 2008 and 2007). Income from discontinued operations in 2006 included gains, net of taxes, of $965 million.
Net cash flows from discontinued operations were $47 million and $112 million for the years ended December 31, 2007 and 2006,
respectively.
(b)
Borrowings (repayments), net, reflects borrowings under the Company’s commercial paper program with original maturities of three
months or less, net of repayments of such borrowings.
(c)
Amounts represent borrowings and repayments related to debt instruments with original maturities greater than three months.
See accompanying notes.
90