Time Warner Cable 2008 Annual Report Download - page 70
Download and view the complete annual report
Please find page 70 of the 2008 Time Warner Cable annual report below. You can navigate through the pages in the report by either clicking on the pages listed below, or by using the keyword search tool below to find specific information within the annual report.-
 1
1 -
2
-
3
-
4
-
5
-
6
-
7
-
8
-
9
-
10
-
11
-
12
-
13
-
14
-
15
-
16
-
17
-
18
-
19
-
20
-
21
-
22
-
23
-
24
-
25
-
26
-
27
-
28
-
29
-
30
-
31
-
32
-
33
-
34
-
35
-
36
-
37
-
38
-
39
-
40
-
41
-
42
-
43
-
44
-
45
-
46
-
47
-
48
-
49
-
50
-
51
-
52
-
53
-
54
-
55
-
56
-
57
-
58
-
59
-
 60
60 -
 61
61 -
 62
62 -
 63
63 -
 64
64 -
 65
65 -
 66
66 -
 67
67 -
 68
68 -
 69
69 -
 70
70 -
 71
71 -
 72
72 -
 73
73 -
 74
74 -
 75
75 -
 76
76 -
 77
77 -
 78
78 -
 79
79 -
 80
80 -
81
-
82
-
83
-
84
-
85
-
86
-
87
-
88
-
89
-
90
-
91
-
92
-
93
-
94
-
95
-
96
-
97
-
98
-
99
-
100
-
101
-
102
-
103
-
104
-
105
-
106
-
107
-
108
-
109
-
110
-
111
-
112
-
113
-
114
-
115
-
116
-
117
-
118
-
119
-
120
-
121
-
122
-
123
-
124
-
125
-
126
-
127
-
128
-
129
-
130
-
131
-
132
-
133
-
134
-
135
-
136
-
137
-
138
-
139
-
140
-
141
-
142
-
143
-
144
-
145
-
146
-
147
-
148
-
149
-
150
-
151
-
152
-
153
-
154
-
155
-
156
-
157
-
158
-
159
-
160
-
161
-
162
-
163
-
164
-
165
-
166
-
167
-
168
-
169
-
170
-
171
-
172
 |
 |

primarily a result of the increased penetration of digital video, high-speed data and Digital Phone and higher video
prices, as discussed above. Average monthly subscription revenue per revenue generating unit remained essentially
flat at $40.61 in 2008 as compared to $40.75 in 2007.
Advertising revenues increased primarily due to an increase in political advertising revenues, partially offset
by a decline in Advertising revenues from national, regional and local businesses. The Company expects that
Advertising revenues will decline in 2009 due to a decline in political advertising revenues and continued weakness
in Advertising revenues from national, regional and local businesses.
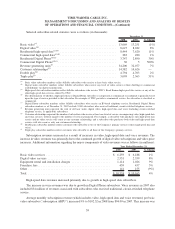
Costs of revenues. The major components of costs of revenues were as follows (in millions):
2008 2007 % Change
Year Ended December 31,
Video programming .......................................... $ 3,753 $ 3,534 6%
Employee .................................................. 2,338 2,164 8%
High-speed data ............................................. 146 164 (11%)
Voice . .................................................... 552 455 21%
Video franchise fees .......................................... 459 437 5%
Other direct operating costs .................................... 897 788 14%
Total . .................................................... $ 8,145 $ 7,542 8%
Costs of revenues increased 8%, primarily related to increases in video programming, employee, voice and
other direct operating costs. As a percentage of revenues, costs of revenues were 47% in both 2008 and 2007.
The increase in video programming costs was primarily due to contractual rate increases and an increase in the
percentage of basic video subscribers who also subscribe to expanded tiers of video services. Average programming
costs per basic video subscriber increased 7% to $23.60 per month in 2008 from $22.04 per month in 2007. The
Company expects video programming costs to increase in 2009 at a rate greater than that experienced in 2008,
reflecting programming rate increases on existing services, costs associated with retransmission consent agree-
ments, subscriber growth and the expansion of service offerings.
Employee costs increased primarily due to higher headcount resulting from the continued growth of digital
video, high-speed data and Digital Phone services, as well as salary increases.
High-speed data costs consist of the direct costs associated with the delivery of high-speed data services,
including network connectivity costs. High-speed data costs decreased primarily due to a decrease in per-subscriber
connectivity costs, partially offset by growth in subscribers and usage per subscriber.
Voice costs consist of the direct costs associated with the delivery of voice services, including network
connectivity costs. Voice costs increased primarily due to growth in Digital Phone subscribers, partially offset by a
decline in per-subscriber connectivity costs due to volume discounts received in 2008.
Other direct operating costs increased primarily due to increases in certain other costs associated with the
continued growth of digital video, high-speed data and Digital Phone services.
60
TIME WARNER CABLE INC.
MANAGEMENT’S DISCUSSION AND ANALYSIS OF RESULTS
OF OPERATIONS AND FINANCIAL CONDITION—(Continued)