Time Warner Cable 2008 Annual Report Download - page 85
Download and view the complete annual report
Please find page 85 of the 2008 Time Warner Cable annual report below. You can navigate through the pages in the report by either clicking on the pages listed below, or by using the keyword search tool below to find specific information within the annual report.-
 1
1 -
2
-
3
-
4
-
5
-
6
-
7
-
8
-
9
-
10
-
11
-
12
-
13
-
14
-
15
-
16
-
17
-
18
-
19
-
20
-
21
-
22
-
23
-
24
-
25
-
26
-
27
-
28
-
29
-
30
-
31
-
32
-
33
-
34
-
35
-
36
-
37
-
38
-
39
-
40
-
41
-
42
-
43
-
44
-
45
-
46
-
47
-
48
-
49
-
50
-
51
-
52
-
53
-
54
-
55
-
56
-
57
-
58
-
59
-
60
-
61
-
62
-
63
-
64
-
65
-
66
-
67
-
68
-
69
-
70
-
71
-
72
-
73
-
74
-
 75
75 -
 76
76 -
 77
77 -
 78
78 -
 79
79 -
 80
80 -
 81
81 -
 82
82 -
 83
83 -
 84
84 -
 85
85 -
 86
86 -
 87
87 -
 88
88 -
 89
89 -
 90
90 -
 91
91 -
 92
92 -
 93
93 -
 94
94 -
 95
95 -
96
-
97
-
98
-
99
-
100
-
101
-
102
-
103
-
104
-
105
-
106
-
107
-
108
-
109
-
110
-
111
-
112
-
113
-
114
-
115
-
116
-
117
-
118
-
119
-
120
-
121
-
122
-
123
-
124
-
125
-
126
-
127
-
128
-
129
-
130
-
131
-
132
-
133
-
134
-
135
-
136
-
137
-
138
-
139
-
140
-
141
-
142
-
143
-
144
-
145
-
146
-
147
-
148
-
149
-
150
-
151
-
152
-
153
-
154
-
155
-
156
-
157
-
158
-
159
-
160
-
161
-
162
-
163
-
164
-
165
-
166
-
167
-
168
-
169
-
170
-
171
-
172
 |
 |

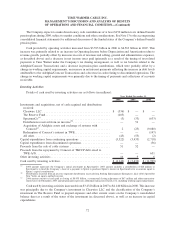
Free Cash Flow
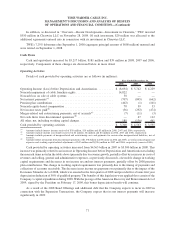
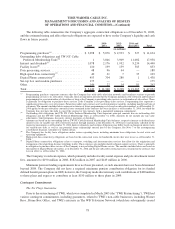
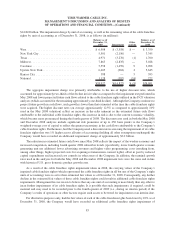
Reconciliation of Cash provided by operating activities to Free Cash Flow. The following table reconciles
Cash provided by operating activities to Free Cash Flow (in millions):
2008 2007 2006
Year Ended December 31,
Cash provided by operating activities ............................ $ 5,300 $ 4,563 $ 3,595
Reconciling items:
Discontinued operations, net of tax ............................ — — (1,038)
Adjustments relating to the operating cash flow of discontinued
operations ............................................. — (47) 926
Cash provided by continuing operating activities .................... 5,300 4,516 3,483
Add: Excess tax benefit from exercise of stock options ............... — 5 4
Less:
Capital expenditures from continuing operations .................. (3,522) (3,433) (2,718)
Partnership tax distributions, stock option distributions and principal
payments on capital leases of continuing operations .............. (5) (28) (34)
Free Cash Flow ............................................ $ 1,773 $ 1,060 $ 735
Free Cash Flow increased from $1.060 billion in 2007 to $1.773 billion in 2008 primarily as a result of an
increase in cash provided by continuing operating activities, partially offset by an increase in capital expenditures,
as discussed above.
Free Cash Flow increased from $735 million in 2006 to $1.060 billion in 2007 primarily as a result of an
increase in cash provided by continuing operating activities, partially offset by an increase in capital expenditures
from continuing operations, as discussed above.
75
TIME WARNER CABLE INC.
MANAGEMENT’S DISCUSSION AND ANALYSIS OF RESULTS
OF OPERATIONS AND FINANCIAL CONDITION—(Continued)