Time Warner Cable 2008 Annual Report Download - page 115
Download and view the complete annual report
Please find page 115 of the 2008 Time Warner Cable annual report below. You can navigate through the pages in the report by either clicking on the pages listed below, or by using the keyword search tool below to find specific information within the annual report.-
 1
1 -
2
-
3
-
4
-
5
-
6
-
7
-
8
-
9
-
10
-
11
-
12
-
13
-
14
-
15
-
16
-
17
-
18
-
19
-
20
-
21
-
22
-
23
-
24
-
25
-
26
-
27
-
28
-
29
-
30
-
31
-
32
-
33
-
34
-
35
-
36
-
37
-
38
-
39
-
40
-
41
-
42
-
43
-
44
-
45
-
46
-
47
-
48
-
49
-
50
-
51
-
52
-
53
-
54
-
55
-
56
-
57
-
58
-
59
-
60
-
61
-
62
-
63
-
64
-
65
-
66
-
67
-
68
-
69
-
70
-
71
-
72
-
73
-
74
-
75
-
76
-
77
-
78
-
79
-
80
-
81
-
82
-
83
-
84
-
85
-
86
-
87
-
88
-
89
-
90
-
91
-
92
-
93
-
94
-
95
-
96
-
97
-
98
-
99
-
100
-
101
-
102
-
103
-
104
-
 105
105 -
 106
106 -
 107
107 -
 108
108 -
 109
109 -
 110
110 -
 111
111 -
 112
112 -
 113
113 -
 114
114 -
 115
115 -
 116
116 -
 117
117 -
 118
118 -
 119
119 -
 120
120 -
 121
121 -
 122
122 -
 123
123 -
 124
124 -
 125
125 -
126
-
127
-
128
-
129
-
130
-
131
-
132
-
133
-
134
-
135
-
136
-
137
-
138
-
139
-
140
-
141
-
142
-
143
-
144
-
145
-
146
-
147
-
148
-
149
-
150
-
151
-
152
-
153
-
154
-
155
-
156
-
157
-
158
-
159
-
160
-
161
-
162
-
163
-
164
-
165
-
166
-
167
-
168
-
169
-
170
-
171
-
172
 |
 |

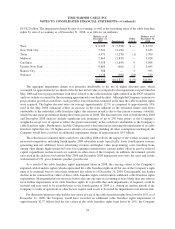
Comprehensive Income (Loss)
Comprehensive income (loss) is reported in the consolidated statement of shareholders’ equity as a component
of retained earnings (deficit) and consists of net income (loss) and other gains and losses affecting shareholders’
equity that, under GAAP, are excluded from net income (loss). For TWC, such items consist of gains and losses on
certain derivative financial instruments and changes in unfunded and underfunded benefit plan obligations. The
following summary sets forth the components of other comprehensive income (loss), net of tax, accumulated in
shareholders’ equity (in millions):
Net
Derivative
Financial
Instrument
Losses
(a)
Net
Change in
Underfunded /
Unfunded
Benefit
Obligation
Net
Accumulated
Other
Comprehensive
Loss
Balance at December 31, 2005.......................... $ — $ (7) $ (7)
2006 activity
(b)
..................................... — (123) (123)
Balance at December 31, 2006.......................... — (130) (130)
2007 activity ....................................... (1) (43) (44)
Balance at December 31, 2007.......................... (1) (173) (174)
2008 activity ....................................... (3) (290) (293)
Balance at December 31, 2008.......................... $ (4) $ (463) $ (467)
(a)
The Company uses derivative instruments to manage the risk associated with movements in foreign currency exchange rates related to
forecasted payments denominated in the Philippine peso made to vendors who provide Road Runner
TM
customer care support services.
(b)
2006 activity primarily reflects the adoption of FASB Statement No. 158, Employers’ Accounting for Defined Benefit Pension and Other
Postretirement Benefits (“FAS 158”), on December 31, 2006. Specifically, as a result of adopting FAS 158, on December 31, 2006, the
Company reflected the funded status of its plans by reducing its net pension asset by $208 million to reflect actuarial and investment losses
that had been deferred pursuant to prior pension accounting rules and recording a corresponding deferred tax asset of $84 million and a net
after-tax charge of $124 million.
Net Income (Loss) per Common Share
Basic net income (loss) per common share is computed by dividing net income by the weighted average of
common shares outstanding during the period. Weighted-average common shares include shares of Class A
common stock and Class B common stock. Diluted net income (loss) per common share adjusts basic net income
(loss) per common share for the effects of stock options and restricted stock units only in the periods in which such
effect is dilutive. Set forth below is a reconciliation of basic and diluted net income (loss) per common share from
continuing operations (in millions, except per share data):
2008 2007 2006
Year Ended December 31,
Net income (loss) from continuing operations ........... $ (7,344) $ 1,123 $ 936
Average common shares outstanding—basic ............ 977.0 976.9 990.4
Dilutive effect of equity awards ..................... — 0.3 —
Average common shares outstanding—diluted ........... 977.0 977.2 990.4
Net income (loss) per common share from continuing
operations:
Basic ....................................... $ (7.52) $ 1.15 $ 0.95
Diluted ...................................... $ (7.52) $ 1.15 $ 0.95
105
TIME WARNER CABLE INC.
NOTES TO CONSOLIDATED FINANCIAL STATEMENTS—(Continued)