Time Warner Cable 2008 Annual Report Download - page 69
Download and view the complete annual report
Please find page 69 of the 2008 Time Warner Cable annual report below. You can navigate through the pages in the report by either clicking on the pages listed below, or by using the keyword search tool below to find specific information within the annual report.-
 1
1 -
2
-
3
-
4
-
5
-
6
-
7
-
8
-
9
-
10
-
11
-
12
-
13
-
14
-
15
-
16
-
17
-
18
-
19
-
20
-
21
-
22
-
23
-
24
-
25
-
26
-
27
-
28
-
29
-
30
-
31
-
32
-
33
-
34
-
35
-
36
-
37
-
38
-
39
-
40
-
41
-
42
-
43
-
44
-
45
-
46
-
47
-
48
-
49
-
50
-
51
-
52
-
53
-
54
-
55
-
56
-
57
-
58
-
 59
59 -
 60
60 -
 61
61 -
 62
62 -
 63
63 -
 64
64 -
 65
65 -
 66
66 -
 67
67 -
 68
68 -
 69
69 -
 70
70 -
 71
71 -
 72
72 -
 73
73 -
 74
74 -
 75
75 -
 76
76 -
 77
77 -
 78
78 -
 79
79 -
80
-
81
-
82
-
83
-
84
-
85
-
86
-
87
-
88
-
89
-
90
-
91
-
92
-
93
-
94
-
95
-
96
-
97
-
98
-
99
-
100
-
101
-
102
-
103
-
104
-
105
-
106
-
107
-
108
-
109
-
110
-
111
-
112
-
113
-
114
-
115
-
116
-
117
-
118
-
119
-
120
-
121
-
122
-
123
-
124
-
125
-
126
-
127
-
128
-
129
-
130
-
131
-
132
-
133
-
134
-
135
-
136
-
137
-
138
-
139
-
140
-
141
-
142
-
143
-
144
-
145
-
146
-
147
-
148
-
149
-
150
-
151
-
152
-
153
-
154
-
155
-
156
-
157
-
158
-
159
-
160
-
161
-
162
-
163
-
164
-
165
-
166
-
167
-
168
-
169
-
170
-
171
-
172
 |
 |

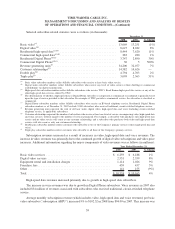
Selected subscriber-related statistics were as follows (in thousands):
2008 2007 % Change
December 31,
Basic video
(a)
................................................. 13,069 13,251 (1%)
Digital video
(b)
................................................ 8,627 8,022 8%
Residential high-speed data
(c)(d)
................................... 8,444 7,620 11%
Commercial high-speed data
(c)(d)
................................... 283 280 1%
Residential Digital Phone
(d)(e)
..................................... 3,747 2,890 30%
Commercial Digital Phone
(d)(e)
.................................... 30 5 500%
Revenue generating units
(f)
....................................... 34,200 32,077 7%
Customer relationships
(g)
........................................ 14,582 14,626 —
Double play
(h)
................................................ 4,794 4,703 2%
Triple play
(i)
................................................. 3,099 2,363 31%
(a)
Basic video subscriber numbers reflect billable subscribers who receive at least basic video service.
(b)
Digital video subscriber numbers reflect billable subscribers who receive any level of video service at their dwelling or commercial
establishment via digital transmissions.
(c)
High-speed data subscriber numbers reflect billable subscribers who receive TWC’s Road Runner high-speed data service or any of the
other high-speed data services offered by TWC.
(d)
The determination of whether a high-speed data or Digital Phone subscriber is categorized as commercial or residential is generally based
upon the type of service provided to that subscriber. For example, if TWC provides a commercial service, the subscriber is classified as
commercial.
(e)
Digital Phone subscriber numbers reflect billable subscribers who receive an IP-based telephony service. Residential Digital Phone
subscriber numbers as of December 31, 2007 exclude 9,000 subscribers who received traditional, circuit-switched telephone service.
(f)
Revenue generating units represent the total of all basic video, digital video, high-speed data and voice (including circuit-switched
telephone service, as applicable) subscribers.
(g)
Customer relationships represent the number of subscribers who receive at least one level of service, encompassing video, high-speed data
and voice services, without regard to the number of services purchased. For example, a subscriber who purchases only high-speed data
service and no video service will count as one customer relationship, and a subscriber who purchases both video and high-speed data
services will also count as only one customer relationship.
(h)
Double play subscriber numbers reflect customers who subscribe to two of the Company’s primary services (video, high-speed data and
voice).
(i)
Triple play subscriber numbers reflect customers who subscribe to all three of the Company’s primary services.
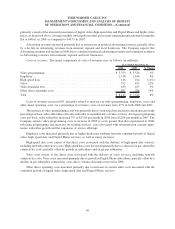
Subscription revenues increased as a result of increases in video, high-speed data and voice revenues. The
increase in video revenues was primarily due to the continued growth of digital video subscriptions and video price
increases. Additional information regarding the major components of video revenues was as follows (in millions):
2008 2007 % Change
Year Ended December 31,
Basic video services ........................................ $ 6,259 $ 6,188 1%
Digital video services ....................................... 2,551 2,359 8%
Equipment rental and installation charges ........................ 1,114 1,026 9%
Franchise fees ............................................. 459 437 5%
Other ................................................... 141 155 (9%)
Total.................................................... $ 10,524 $ 10,165 4%
High-speed data revenues increased primarily due to growth in high-speed data subscribers.
The increase in voice revenues was due to growth in Digital Phone subscribers. Voice revenues in 2007 also
included $34 million of revenues associated with subscribers who received traditional, circuit-switched telephone
service.
Average monthly subscription revenue (which includes video, high-speed data and voice revenues) per basic
video subscriber (“subscription ARPU”) increased 9% to $102.52 in 2008 from $94.09 in 2007. This increase was
59
TIME WARNER CABLE INC.
MANAGEMENT’S DISCUSSION AND ANALYSIS OF RESULTS
OF OPERATIONS AND FINANCIAL CONDITION—(Continued)