Time Warner Cable 2008 Annual Report Download - page 77
Download and view the complete annual report
Please find page 77 of the 2008 Time Warner Cable annual report below. You can navigate through the pages in the report by either clicking on the pages listed below, or by using the keyword search tool below to find specific information within the annual report.-
 1
1 -
2
-
3
-
4
-
5
-
6
-
7
-
8
-
9
-
10
-
11
-
12
-
13
-
14
-
15
-
16
-
17
-
18
-
19
-
20
-
21
-
22
-
23
-
24
-
25
-
26
-
27
-
28
-
29
-
30
-
31
-
32
-
33
-
34
-
35
-
36
-
37
-
38
-
39
-
40
-
41
-
42
-
43
-
44
-
45
-
46
-
47
-
48
-
49
-
50
-
51
-
52
-
53
-
54
-
55
-
56
-
57
-
58
-
59
-
60
-
61
-
62
-
63
-
64
-
65
-
66
-
 67
67 -
 68
68 -
 69
69 -
 70
70 -
 71
71 -
 72
72 -
 73
73 -
 74
74 -
 75
75 -
 76
76 -
 77
77 -
 78
78 -
 79
79 -
 80
80 -
 81
81 -
 82
82 -
 83
83 -
 84
84 -
 85
85 -
 86
86 -
 87
87 -
88
-
89
-
90
-
91
-
92
-
93
-
94
-
95
-
96
-
97
-
98
-
99
-
100
-
101
-
102
-
103
-
104
-
105
-
106
-
107
-
108
-
109
-
110
-
111
-
112
-
113
-
114
-
115
-
116
-
117
-
118
-
119
-
120
-
121
-
122
-
123
-
124
-
125
-
126
-
127
-
128
-
129
-
130
-
131
-
132
-
133
-
134
-
135
-
136
-
137
-
138
-
139
-
140
-
141
-
142
-
143
-
144
-
145
-
146
-
147
-
148
-
149
-
150
-
151
-
152
-
153
-
154
-
155
-
156
-
157
-
158
-
159
-
160
-
161
-
162
-
163
-
164
-
165
-
166
-
167
-
168
-
169
-
170
-
171
-
172
 |
 |

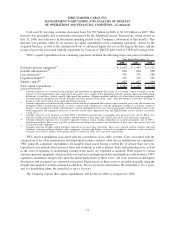
Other direct operating costs increased primarily due to the impact of the Acquired Systems and the
consolidation of the Kansas City Pool, as well as certain other increases in costs associated with the continued
roll-out of advanced services.
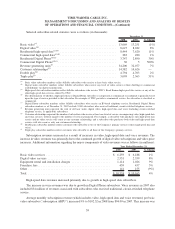
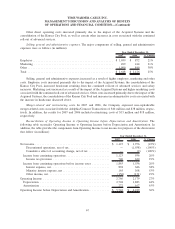
Selling, general and administrative expenses. The major components of selling, general and administrative
expenses were as follows (in millions):
2007 2006 % Change
Year Ended December 31,
Employee .................................................. $ 1,059 $ 872 21%
Marketing ................................................. 499 414 21%
Other . .................................................... 1,090 840 30%
Total . .................................................... $ 2,648 $ 2,126 25%
Selling, general and administrative expenses increased as a result of higher employee, marketing and other
costs. Employee costs increased primarily due to the impact of the Acquired Systems, the consolidation of the
Kansas City Pool, increased headcount resulting from the continued roll-out of advanced services and salary
increases. Marketing costs increased as a result of the impact of the Acquired Systems and higher marketing costs
associated with the continued roll-out of advanced services. Other costs increased primarily due to the impact of the
Acquired Systems, the consolidation of the Kansas City Pool and increases in administrative costs associated with
the increase in headcount discussed above.
Merger-related and restructuring costs. In 2007 and 2006, the Company expensed non-capitalizable
merger-related costs associated with the Adelphia/Comcast Transactions of $10 million and $38 million, respec-
tively. In addition, the results for 2007 and 2006 included restructuring costs of $13 million and $18 million,
respectively.
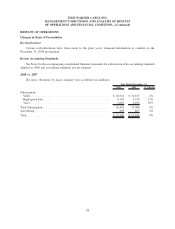
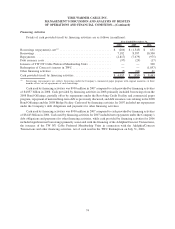
Reconciliation of Operating Income to Operating Income before Depreciation and Amortization. The
following table reconciles Operating Income to Operating Income before Depreciation and Amortization. In
addition, the table provides the components from Operating Income to net income for purposes of the discussions
that follow (in millions):
2007 2006 % Change
Year Ended December 31,
Net income .............................................. $ 1,123 $ 1,976 (43%)
Discontinued operations, net of tax ......................... — (1,038) (100%)
Cumulative effect of accounting change, net of tax ............. — (2) (100%)
Income from continuing operations ........................... 1,123 936 20%
Income tax provision ................................... 740 620 19%
Income from continuing operations before income taxes ........... 1,863 1,556 20%
Interest expense, net .................................... 894 646 38%
Minority interest expense, net ............................. 165 108 53%
Other income, net ...................................... (156) (131) 19%
Operating Income ......................................... 2,766 2,179 27%
Depreciation . .......................................... 2,704 1,883 44%
Amortization . .......................................... 272 167 63%
Operating Income before Depreciation and Amortization............. $ 5,742 $ 4,229 36%
67
TIME WARNER CABLE INC.
MANAGEMENT’S DISCUSSION AND ANALYSIS OF RESULTS
OF OPERATIONS AND FINANCIAL CONDITION—(Continued)