Time Warner Cable 2008 Annual Report Download - page 150
Download and view the complete annual report
Please find page 150 of the 2008 Time Warner Cable annual report below. You can navigate through the pages in the report by either clicking on the pages listed below, or by using the keyword search tool below to find specific information within the annual report.-
 1
1 -
2
-
3
-
4
-
5
-
6
-
7
-
8
-
9
-
10
-
11
-
12
-
13
-
14
-
15
-
16
-
17
-
18
-
19
-
20
-
21
-
22
-
23
-
24
-
25
-
26
-
27
-
28
-
29
-
30
-
31
-
32
-
33
-
34
-
35
-
36
-
37
-
38
-
39
-
40
-
41
-
42
-
43
-
44
-
45
-
46
-
47
-
48
-
49
-
50
-
51
-
52
-
53
-
54
-
55
-
56
-
57
-
58
-
59
-
60
-
61
-
62
-
63
-
64
-
65
-
66
-
67
-
68
-
69
-
70
-
71
-
72
-
73
-
74
-
75
-
76
-
77
-
78
-
79
-
80
-
81
-
82
-
83
-
84
-
85
-
86
-
87
-
88
-
89
-
90
-
91
-
92
-
93
-
94
-
95
-
96
-
97
-
98
-
99
-
100
-
101
-
102
-
103
-
104
-
105
-
106
-
107
-
108
-
109
-
110
-
111
-
112
-
113
-
114
-
115
-
116
-
117
-
118
-
119
-
120
-
121
-
122
-
123
-
124
-
125
-
126
-
127
-
128
-
129
-
130
-
131
-
132
-
133
-
134
-
135
-
136
-
137
-
138
-
139
-
 140
140 -
 141
141 -
 142
142 -
 143
143 -
 144
144 -
 145
145 -
 146
146 -
 147
147 -
 148
148 -
 149
149 -
 150
150 -
 151
151 -
 152
152 -
 153
153 -
 154
154 -
 155
155 -
 156
156 -
 157
157 -
 158
158 -
 159
159 -
 160
160 -
161
-
162
-
163
-
164
-
165
-
166
-
167
-
168
-
169
-
170
-
171
-
172
 |
 |

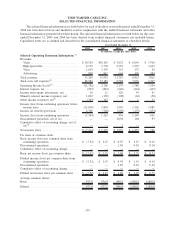
2008 2007 2006 2005 2004
December 31,
(in millions)
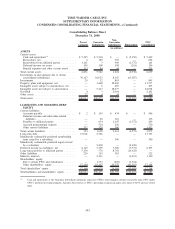
Selected Balance Sheet Information:
(a)
Cash and equivalents .................... $ 5,449 $ 232 $ 51 $ 12 $ 102
Total assets ........................... 47,889 56,600 55,821 43,724 43,189
Total debt and preferred equity ............. 18,028 13,877 14,732 6,863 7,299
Cash dividends declared per common share .... —————
(a)
The following items impact the comparability of results from period to period: (i) on January 1, 2007, TWC began consolidating the
results of the Kansas City Pool it received upon the distribution of the assets of TKCCP, which previously was accounted for as an equity-
method investee and (ii) on July 31, 2006, a subsidiary of TWC and Comcast completed the Adelphia/Comcast Transactions.
(b)
Total costs and expenses and Operating Income (Loss) in 2008 includes a $14.822 billion impairment on cable franchise rights as a result
of the Company’s annual impairment testing and a $58 million loss on the sale of cable systems. Total costs and expenses and Operating
Income (Loss) also include restructuring costs of $15 million in 2008 and merger-related and restructuring costs of $23 million in 2007,
$56 million in 2006 and $42 million in 2005 (none in 2004).
(c)
Other income (expense), net, in 2008 includes pretax impairments on equity-method investments totaling $375 million, primarily
consisting of a $367 million impairment on the Company’s investment in Clearwire LLC, $17 million of direct transaction costs (e.g.,
legal and professional fees) related to the Separation, and a pretax gain of $9 million recorded on the sale of a cost-method investment.
Other income (expense), net, in 2007 includes a pretax gain of $146 million related to the sale of TWC’s 50% equity interest in the
Houston Pool of TKCCP.
(d)
Cumulative effect of accounting change, net of tax, includes a benefit of $2 million in 2006 related to the cumulative effect of a change in
accounting principle in connection with the adoption of FAS 123R.
140