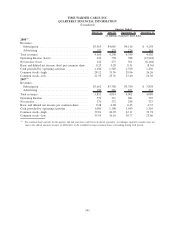
Time Warner Cable 2008 Annual Report Download - page 160
Download and view the complete annual report
Please find page 160 of the 2008 Time Warner Cable annual report below. You can navigate through the pages in the report by either clicking on the pages listed below, or by using the keyword search tool below to find specific information within the annual report.-
 1
1 -
2
-
3
-
4
-
5
-
6
-
7
-
8
-
9
-
10
-
11
-
12
-
13
-
14
-
15
-
16
-
17
-
18
-
19
-
20
-
21
-
22
-
23
-
24
-
25
-
26
-
27
-
28
-
29
-
30
-
31
-
32
-
33
-
34
-
35
-
36
-
37
-
38
-
39
-
40
-
41
-
42
-
43
-
44
-
45
-
46
-
47
-
48
-
49
-
50
-
51
-
52
-
53
-
54
-
55
-
56
-
57
-
58
-
59
-
60
-
61
-
62
-
63
-
64
-
65
-
66
-
67
-
68
-
69
-
70
-
71
-
72
-
73
-
74
-
75
-
76
-
77
-
78
-
79
-
80
-
81
-
82
-
83
-
84
-
85
-
86
-
87
-
88
-
89
-
90
-
91
-
92
-
93
-
94
-
95
-
96
-
97
-
98
-
99
-
100
-
101
-
102
-
103
-
104
-
105
-
106
-
107
-
108
-
109
-
110
-
111
-
112
-
113
-
114
-
115
-
116
-
117
-
118
-
119
-
120
-
121
-
122
-
123
-
124
-
125
-
126
-
127
-
128
-
129
-
130
-
131
-
132
-
133
-
134
-
135
-
136
-
137
-
138
-
139
-
140
-
141
-
142
-
143
-
144
-
145
-
146
-
147
-
148
-
149
-
 150
150 -
 151
151 -
 152
152 -
 153
153 -
 154
154 -
 155
155 -
 156
156 -
 157
157 -
 158
158 -
 159
159 -
 160
160 -
 161
161 -
 162
162 -
 163
163 -
 164
164 -
 165
165 -
 166
166 -
 167
167 -
 168
168 -
 169
169 -
 170
170 -
171
-
172
 |
 |

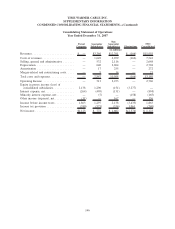
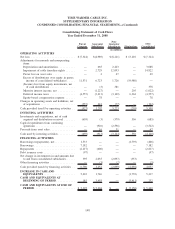
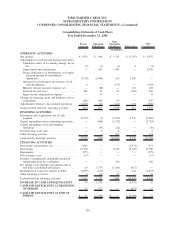
Consolidating Statement of Cash Flows
Year Ended December 31, 2006
Parent
Company
Guarantor
Subsidiaries
Non-
Guarantor
Subsidiaries Eliminations
TWC
Consolidated
(in millions)
OPERATING ACTIVITIES
Net income . . . . . . . . . . . . . . . . . . . . . . . . . . . . $ 1,976 $ 664 $ 1,533 $ (2,197) $ 1,976
Adjustments for noncash and nonoperating items:
Cumulative effect of accounting change, net of
tax .............................. (2) (1) (3) 4 (2)
Depreciation and amortization . . . . . . . . . . . . . — 661 1,389 — 2,050
Excess (deficiency) of distributions over equity
in pretax income of consolidated
subsidiaries . . . . . . . . . . . . . . . . . . . . . . . . (1,710) (1,044) 165 2,589 —
(Income) loss from equity investments, net of
cash distributions . . . . . . . . . . . . . . . . . . . . 6 — (135) — (129)
Minority interest (income) expense, net . . . . . . — (28) — 136 108
Deferred income taxes . . . . . . . . . . . . . . . . . . 240 93 93 (186) 240
Equity-based compensation expense . . . . . . . . . — 33 — — 33
Changes in operating assets and liabilities, net of
acquisitions . . . . . . . . . . . . . . . . . . . . . . . . . . (286) 468 63 — 245
Adjustments relating to discontinued operations . . (1,038) (13) (146) 271 (926)
Cash provided (used) by operating activities . . . . . (814) 833 2,959 617 3,595
INVESTING ACTIVITIES
Investments and acquisitions, net of cash
acquired . . . . . . . . . . . . . . . . . . . . . . . . . . . . (8,712) (1) (9,704) 8,555 (9,862)
Capital expenditures from continuing operations . . — (966) (1,752) — (2,718)
Capital expenditures from discontinued
operations . . . . . . . . . . . . . . . . . . . . . . . . . . . — (34) (22) — (56)
Proceeds from asset sales . . . . . . . . . . . . . . . . . . — 2 4 — 6
Other investing activities . . . . . . . . . . . . . . . . . . — — 631 — 631
Cash used by investing activities . . . . . . . . . . . . . (8,712) (999) (10,843) 8,555 (11,999)
FINANCING ACTIVITIES
Borrowings (repayments), net . . . . . . . . . . . . . . . 2,082 — — (1,431) 651
Borrowings . . . . . . . . . . . . . . . . . . . . . . . . . . . . 10,300 — 8,702 (8,702) 10,300
Repayments . . . . . . . . . . . . . . . . . . . . . . . . . . . (975) — — — (975)
Debt issuance costs . . . . . . . . . . . . . . . . . . . . . . (17) — — — (17)
Issuance of mandatorily redeemable preferred
membership units by a subsidiary . . . . . . . . . . — — 300 — 300
Net change in investments and amounts due to
and from consolidated subsidiaries . . . . . . . . . . 28 1,775 (1,186) (617) —
Redemption of Comcast’s interest in TWC . . . . . . (1,857) (147) — 147 (1,857)
Other financing activities . . . . . . . . . . . . . . . . . . 4 (31) 68 — 41
Cash provided by financing activities . . . . . . . . . . 9,565 1,597 7,884 (10,603) 8,443
INCREASE IN CASH AND EQUIVALENTS . . 39 1,431 — (1,431) 39
CASH AND EQUIVALENTS AT BEGINNING
OF PERIOD . . . . . . . . . . . . . . . . . . . . . . . . 12 873 — (873) 12
CASH AND EQUIVALENTS AT END OF
PERIOD . . . . . . . . . . . . . . . . . . . . . . . . . . . $ 51 $ 2,304 $ — $ (2,304) $ 51
150
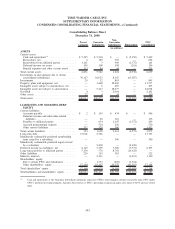
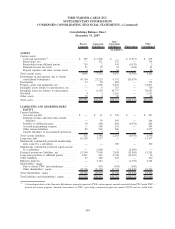
TIME WARNER CABLE INC.
SUPPLEMENTARY INFORMATION
CONDENSED CONSOLIDATING FINANCIAL STATEMENTS—(Continued)