Time Warner Cable 2008 Annual Report Download - page 149
Download and view the complete annual report
Please find page 149 of the 2008 Time Warner Cable annual report below. You can navigate through the pages in the report by either clicking on the pages listed below, or by using the keyword search tool below to find specific information within the annual report.-
 1
1 -
2
-
3
-
4
-
5
-
6
-
7
-
8
-
9
-
10
-
11
-
12
-
13
-
14
-
15
-
16
-
17
-
18
-
19
-
20
-
21
-
22
-
23
-
24
-
25
-
26
-
27
-
28
-
29
-
30
-
31
-
32
-
33
-
34
-
35
-
36
-
37
-
38
-
39
-
40
-
41
-
42
-
43
-
44
-
45
-
46
-
47
-
48
-
49
-
50
-
51
-
52
-
53
-
54
-
55
-
56
-
57
-
58
-
59
-
60
-
61
-
62
-
63
-
64
-
65
-
66
-
67
-
68
-
69
-
70
-
71
-
72
-
73
-
74
-
75
-
76
-
77
-
78
-
79
-
80
-
81
-
82
-
83
-
84
-
85
-
86
-
87
-
88
-
89
-
90
-
91
-
92
-
93
-
94
-
95
-
96
-
97
-
98
-
99
-
100
-
101
-
102
-
103
-
104
-
105
-
106
-
107
-
108
-
109
-
110
-
111
-
112
-
113
-
114
-
115
-
116
-
117
-
118
-
119
-
120
-
121
-
122
-
123
-
124
-
125
-
126
-
127
-
128
-
129
-
130
-
131
-
132
-
133
-
134
-
135
-
136
-
137
-
138
-
 139
139 -
 140
140 -
 141
141 -
 142
142 -
 143
143 -
 144
144 -
 145
145 -
 146
146 -
 147
147 -
 148
148 -
 149
149 -
 150
150 -
 151
151 -
 152
152 -
 153
153 -
 154
154 -
 155
155 -
 156
156 -
 157
157 -
 158
158 -
 159
159 -
160
-
161
-
162
-
163
-
164
-
165
-
166
-
167
-
168
-
169
-
170
-
171
-
172
 |
 |

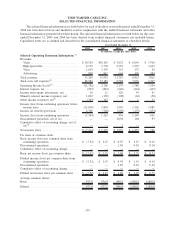
TIME WARNER CABLE INC.
SELECTED FINANCIAL INFORMATION
The selected financial information set forth below for each of the three years in the period ended December 31,
2008 has been derived from and should be read in conjunction with the audited financial statements and other
financial information presented elsewhere herein. The selected financial information set forth below for the years
ended December 31, 2005 and 2004 has been derived from audited financial statements not included herein.
Capitalized terms are as defined and described in the consolidated financial statements or elsewhere herein.
2008 2007 2006 2005 2004
Year Ended December 31,
(in millions, except per share data)
Selected Operating Statement Information:
(a)
Revenues:
Video .............................. $10,524 $10,165 $ 7,632 $ 6,044 $ 5,706
High-speed data ...................... 4,159 3,730 2,756 1,997 1,642
Voice .............................. 1,619 1,193 715 272 29
Advertising. ......................... 898 867 664 499 484
Total revenues ......................... 17,200 15,955 11,767 8,812 7,861
Total costs and expenses
(b)
................ 28,982 13,189 9,588 7,026 6,307
Operating Income (Loss)
(b)
................ (11,782) 2,766 2,179 1,786 1,554
Interest expense, net . . . .................. (923) (894) (646) (464) (465)
Income from equity investments, net ......... 16 11 129 43 41
Minority interest income (expense), net . . . .... 1,022 (165) (108) (64) (56)
Other income (expense), net
(c)
.............. (383) 145 2 1 11
Income (loss) from continuing operations before
income taxes ........................ (12,050) 1,863 1,556 1,302 1,085
Income tax benefit (provision) . . ........... 4,706 (740) (620) (153) (454)
Income (loss) from continuing operations . .... (7,344) 1,123 936 1,149 631
Discontinued operations, net of tax .......... — — 1,038 104 95
Cumulative effect of accounting change, net of
tax
(d)
.............................. — — 2 — —
Net income (loss) ....................... $ (7,344) $ 1,123 $ 1,976 $ 1,253 $ 726
Per share of common stock:
Basic income (loss) per common share from
continuing operations .................. $ (7.52) $ 1.15 $ 0.95 $ 1.15 $ 0.63
Discontinued operations .................. — — 1.05 0.10 0.10
Cumulative effect of accounting change. . . .... — — — — —
Basic net income (loss) per common share .... $ (7.52) $ 1.15 $ 2.00 $ 1.25 $ 0.73
Diluted income (loss) per common share from
continuing operations .................. $ (7.52) $ 1.15 $ 0.95 $ 1.15 $ 0.63
Discontinued operations .................. — — 1.05 0.10 0.10
Cumulative effect of accounting change. . . .... — — — — —
Diluted net income (loss) per common share . . . $ (7.52) $ 1.15 $ 2.00 $ 1.25 $ 0.73
Average common shares:
Basic ................................ 977.0 976.9 990.4 1,000.0 1,000.0
Diluted .............................. 977.0 977.2 990.4 1,000.0 1,000.0
139