Time Warner Cable 2006 Annual Report Download - page 90
Download and view the complete annual report
Please find page 90 of the 2006 Time Warner Cable annual report below. You can navigate through the pages in the report by either clicking on the pages listed below, or by using the keyword search tool below to find specific information within the annual report.-
 1
1 -
2
-
3
-
4
-
5
-
6
-
7
-
8
-
9
-
10
-
11
-
12
-
13
-
14
-
15
-
16
-
17
-
18
-
19
-
20
-
21
-
22
-
23
-
24
-
25
-
26
-
27
-
28
-
29
-
30
-
31
-
32
-
33
-
34
-
35
-
36
-
37
-
38
-
39
-
40
-
41
-
42
-
43
-
44
-
45
-
46
-
47
-
48
-
49
-
50
-
51
-
52
-
53
-
54
-
55
-
56
-
57
-
58
-
59
-
60
-
61
-
62
-
63
-
64
-
65
-
66
-
67
-
68
-
69
-
70
-
71
-
72
-
73
-
74
-
75
-
76
-
77
-
78
-
79
-
 80
80 -
 81
81 -
 82
82 -
 83
83 -
 84
84 -
 85
85 -
 86
86 -
 87
87 -
 88
88 -
 89
89 -
 90
90 -
 91
91 -
 92
92 -
 93
93 -
 94
94 -
 95
95 -
 96
96 -
 97
97 -
 98
98 -
 99
99 -
 100
100 -
101
-
102
-
103
-
104
-
105
-
106
-
107
-
108
-
109
-
110
-
111
-
112
-
113
-
114
-
115
-
116
-
117
-
118
-
119
-
120
-
121
-
122
-
123
-
124
-
125
-
126
-
127
-
128
-
129
-
130
-
131
-
132
-
133
-
134
-
135
-
136
-
137
-
138
-
139
-
140
-
141
-
142
-
143
-
144
-
145
-
146
-
147
-
148
-
149
-
150
-
151
-
152
-
153
-
154
-
155
-
156
-
157
-
158
-
159
-
160
-
161
-
162
-
163
-
164
-
165
-
166
 |
 |

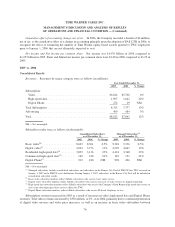
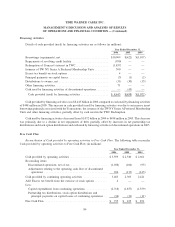
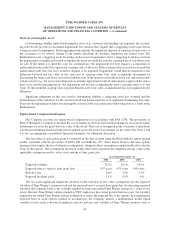
Free Cash Flow increased to $735 million during 2006, as compared to $435 million during 2005. This
increase of $300 million was primarily driven by a $906 million increase in OIBDA, as previously discussed, and a
decrease in working capital requirements, partially offset by an increase in capital expenditures from continuing
operations.
Free Cash Flow decreased to $435 million during 2005 as compared to $851 million during 2004. This
decrease of $416 million was primarily driven by increases in net cash tax payments and capital expenditures from
continuing operations, partially offset by an increase in OIBDA, as previously discussed, and a decrease in
contributions to the Company’s pension plans.
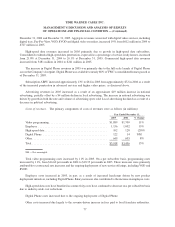
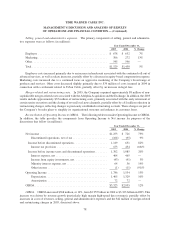
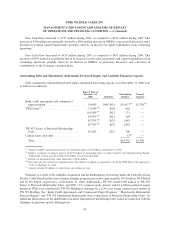
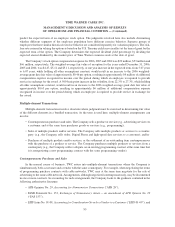
Outstanding Debt and Mandatorily Redeemable Preferred Equity and Available Financial Capacity
Debt, mandatorily redeemable preferred equity and unused borrowing capacity, as of December 31, 2006 were
as follows (in millions):
Interest Rate at
December 31,
2006 Maturity
Outstanding
Balance
Unused
Capacity
Bank credit agreements and commercial
paper program ...................... 5.680% 2009-2011 $11,077
(a)
$2,798
(b)
TWE Notes
(c)
........................ 7.250%
(d)
2008 602 —
10.150%
(d)
2012 271 —
8.875%
(d)
2012 369 —
8.375%
(d)
2023 1,043 —
8.375%
(d)
2033 1,055 —
TW NY Series A Preferred Membership
Units ............................. 8.210% 2013 300 —
Capital leases and other ................. 15
(e)
—
Total ............................. $14,732 $2,798
(a)
Amount excludes unamortized discount on commercial paper of $17 million at December 31, 2006.
(b)
Reflects a reduction of unused capacity for $159 million of outstanding letters of credit backed by the Cable Revolving Facility.
Additionally, unused capacity includes $51 million of cash and equivalents.
(c)
Includes an unamortized fair value adjustment of $140 million.
(d)
Rate represents the stated rate at original issuance. The effective weighted-average interest rate for the TWE Notes in the aggregate is
7.61% at December 31, 2006.
(e)
Amount includes $4 million of capital leases due within one year.
Primarily as a result of the Adelphia Acquisition and the Redemptions, borrowings under the Cable Revolving
Facility, Cable Term Facilities and commercial paper program increased to approximately $925 million, $8.0 billion
and $2.152 billion, respectively, at December 31, 2006. Additionally, TW NY issued $300 million of TW NY
Series A Preferred Membership Units, and ATC’s 1% common equity interest and $2.4 billion preferred equity
interest in TWE were contributed to TW NY Holding in exchange for a 12.4% non-voting common stock interest in
TW NY Holding. See “Bank Credit Agreements and Commercial Paper Programs,” “Mandatorily Redeemable
Preferred Equity” and “TW NY Mandatorily Redeemable Non-voting Series A Preferred Membership Units” for
additional information on the indebtedness incurred and preferred membership units issued in connection with the
Adelphia Acquisition and the Redemptions.
85
TIME WARNER CABLE INC.
MANAGEMENT’S DISCUSSION AND ANALYSIS OF RESULTS
OF OPERATIONS AND FINANCIAL CONDITION — (Continued)