Time Warner Cable 2006 Annual Report Download - page 156
Download and view the complete annual report
Please find page 156 of the 2006 Time Warner Cable annual report below. You can navigate through the pages in the report by either clicking on the pages listed below, or by using the keyword search tool below to find specific information within the annual report.-
 1
1 -
2
-
3
-
4
-
5
-
6
-
7
-
8
-
9
-
10
-
11
-
12
-
13
-
14
-
15
-
16
-
17
-
18
-
19
-
20
-
21
-
22
-
23
-
24
-
25
-
26
-
27
-
28
-
29
-
30
-
31
-
32
-
33
-
34
-
35
-
36
-
37
-
38
-
39
-
40
-
41
-
42
-
43
-
44
-
45
-
46
-
47
-
48
-
49
-
50
-
51
-
52
-
53
-
54
-
55
-
56
-
57
-
58
-
59
-
60
-
61
-
62
-
63
-
64
-
65
-
66
-
67
-
68
-
69
-
70
-
71
-
72
-
73
-
74
-
75
-
76
-
77
-
78
-
79
-
80
-
81
-
82
-
83
-
84
-
85
-
86
-
87
-
88
-
89
-
90
-
91
-
92
-
93
-
94
-
95
-
96
-
97
-
98
-
99
-
100
-
101
-
102
-
103
-
104
-
105
-
106
-
107
-
108
-
109
-
110
-
111
-
112
-
113
-
114
-
115
-
116
-
117
-
118
-
119
-
120
-
121
-
122
-
123
-
124
-
125
-
126
-
127
-
128
-
129
-
130
-
131
-
132
-
133
-
134
-
135
-
136
-
137
-
138
-
139
-
140
-
141
-
142
-
143
-
144
-
145
-
 146
146 -
 147
147 -
 148
148 -
 149
149 -
 150
150 -
 151
151 -
 152
152 -
 153
153 -
 154
154 -
 155
155 -
 156
156 -
 157
157 -
 158
158 -
 159
159 -
 160
160 -
 161
161 -
 162
162 -
 163
163 -
 164
164 -
 165
165 -
 166
166
 |
 |

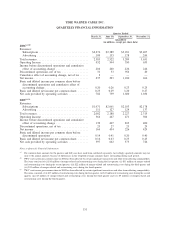
TIME WARNER CABLE INC.
QUARTERLY FINANCIAL INFORMATION
March 31, June 30, September 30, December 31,
Quarter Ended
(unaudited)
(in millions, except per share data)
2006
(a)(b)
Revenues:
Subscriptions ................................ $2,276 $2,389 $3,031 $3,407
Advertising ................................. 109 133 178 244
Total revenues ................................. 2,385 2,522 3,209 3,651
Operating Income .............................. 452 544 550 633
Income before discontinued operations and cumulative
effect of accounting change ..................... 204 260 226 246
Discontinued operations, net of tax ................. 31 33 954 20
Cumulative effect of accounting change, net of tax ...... 2 — — —
Net income ................................... 237 293 1,180 266
Basic and diluted income per common share before
discontinued operations and cumulative effect of
accounting change ............................ 0.20 0.26 0.23 0.25
Basic and diluted net income per common share........ 0.23 0.29 1.20 0.27
Net cash provided by operating activities ............. 782 759 1,020 1,034
2005
(a)(c)
Revenues:
Subscriptions ................................ $1,971 $2,061 $2,103 $2,178
Advertising ................................. 111 127 124 137
Total revenues ................................. 2,082 2,188 2,227 2,315
Operating Income .............................. 364 447 471 504
Income before discontinued operations and cumulative
effect of accounting change ..................... 139 407 203 400
Discontinued operations, net of tax ................. 25 27 23 29
Net income ................................... 164 434 226 429
Basic and diluted income per common share before
discontinued operations ........................ 0.14 0.41 0.20 0.40
Basic and diluted net income per common share........ 0.16 0.43 0.23 0.43
Net cash provided by operating activities ............. 597 642 575 726
Notes to Quarterly Financial Information
(a)
Per common share amounts for the quarters and full years have each been calculated separately. Accordingly, quarterly amounts may not
sum to the annual amounts because of differences in the weighted-average common shares outstanding during each period.
(b)
TWC’s net income per common share in 2006 has been affected by certain significant transactions and other items affecting comparability.
The items consisted of (i) $10 million of merger-related and restructuring costs during the first quarter, (ii) $11 million of merger-related
and restructuring costs during the second quarter, (iii) $22 million of merger-related and restructuring costs during the third quarter and
(vi) $13 million of merger-related and restructuring costs during the fourth quarter.
(c)
TWC’s net income per common share in 2005 has been affected by certain significant transactions and other items affecting comparability.
The items consisted of (i) $17 million of restructuring costs during the first quarter, (ii) $13 million of restructuring costs during the second
quarter, (iii) $3 million of merger-related and restructuring costs during the third quarter and (vi) $9 million of merger-related and
restructuring costs during the fourth quarter.
151