Time Warner Cable 2006 Annual Report Download - page 77
Download and view the complete annual report
Please find page 77 of the 2006 Time Warner Cable annual report below. You can navigate through the pages in the report by either clicking on the pages listed below, or by using the keyword search tool below to find specific information within the annual report.-
 1
1 -
2
-
3
-
4
-
5
-
6
-
7
-
8
-
9
-
10
-
11
-
12
-
13
-
14
-
15
-
16
-
17
-
18
-
19
-
20
-
21
-
22
-
23
-
24
-
25
-
26
-
27
-
28
-
29
-
30
-
31
-
32
-
33
-
34
-
35
-
36
-
37
-
38
-
39
-
40
-
41
-
42
-
43
-
44
-
45
-
46
-
47
-
48
-
49
-
50
-
51
-
52
-
53
-
54
-
55
-
56
-
57
-
58
-
59
-
60
-
61
-
62
-
63
-
64
-
65
-
66
-
 67
67 -
 68
68 -
 69
69 -
 70
70 -
 71
71 -
 72
72 -
 73
73 -
 74
74 -
 75
75 -
 76
76 -
 77
77 -
 78
78 -
 79
79 -
 80
80 -
 81
81 -
 82
82 -
 83
83 -
 84
84 -
 85
85 -
 86
86 -
 87
87 -
88
-
89
-
90
-
91
-
92
-
93
-
94
-
95
-
96
-
97
-
98
-
99
-
100
-
101
-
102
-
103
-
104
-
105
-
106
-
107
-
108
-
109
-
110
-
111
-
112
-
113
-
114
-
115
-
116
-
117
-
118
-
119
-
120
-
121
-
122
-
123
-
124
-
125
-
126
-
127
-
128
-
129
-
130
-
131
-
132
-
133
-
134
-
135
-
136
-
137
-
138
-
139
-
140
-
141
-
142
-
143
-
144
-
145
-
146
-
147
-
148
-
149
-
150
-
151
-
152
-
153
-
154
-
155
-
156
-
157
-
158
-
159
-
160
-
161
-
162
-
163
-
164
-
165
-
166
 |
 |

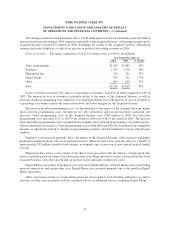
Advertising revenues increased primarily due to a $136 million increase in local advertising and a $29 million
increase in national advertising in 2006, primarily attributable to the Acquired Systems. Advertising revenues in the
Acquired Systems totaled $137 million in 2006. Excluding the results of the Acquired Systems, Advertising
revenues increased slightly as a result of an increase in political advertising revenues in 2006.
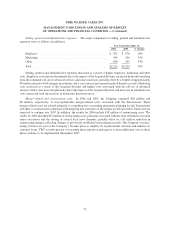
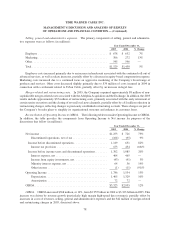
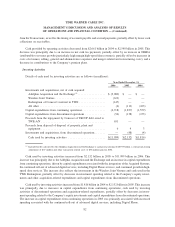
Costs of revenues. The major components of costs of revenues were as follows (in millions):
2006 2005 % Change
Year Ended December 31,
Video programming ..................................... $2,523 $1,889 34%
Employee ............................................ 1,505 1,156 30%
High-speed data ........................................ 156 102 53%
Digital Phone ......................................... 309 122 153%
Other................................................ 863 649 33%
Total ................................................ $5,356 $3,918 37%
Costs of revenues increased 37%, and, as a percentage of revenues, were 46% in 2006 compared to 44% in
2005. The increase in costs of revenues is primarily related to the impact of the Acquired Systems, as well as
increases in video programming costs, employee costs and Digital Phone costs. The increase in costs of revenues as
a percentage of revenues reflects the items noted above and lower margins for the Acquired Systems.
The increase in video programming costs was due primarily to the impact of the Acquired Systems, higher
sports network programming costs, the increase in video subscribers and non-sports-related contractual rate
increases. Video programming costs in the Acquired Systems were $409 million in 2006. Per subscriber
programming costs increased 11%, to $20.33 per month in 2006 from $18.35 per month in 2005. The increase
in per subscriber programming costs was primarily due to higher sports network programming costs and non-sports-
related contractual rate increases. Video programming costs in both 2006 and 2005 also benefited from comparable
amounts of adjustments related to changes in programming estimates and the settlement of terms with program
vendors.
Employee costs increased primarily due to the impact of the Acquired Systems, salary increases and higher
headcount resulting from the roll-out of advanced services. These increases were partially offset by a benefit of
approximately $32 million related to both changes in estimates and a correction of prior period medical benefit
accruals.
High-speed data service costs consist of the direct costs associated with the delivery of high-speed data
services, including network connectivity and certain other costs. High-speed data service costs increased due to the
Acquired Systems, subscriber growth and an increase in per subscriber connectivity costs.
Digital Phone costs consist of the direct costs associated with the delivery of Digital Phone services, including
network connectivity and certain other costs. Digital Phone costs increased primarily due to the growth in Digital
Phone subscribers.
Other costs increased due to revenue-driven increases in fees paid to local franchise authorities, as well as
increases in other costs associated with the continued roll-out of advanced services, including Digital Phone.
72
TIME WARNER CABLE INC.
MANAGEMENT’S DISCUSSION AND ANALYSIS OF RESULTS
OF OPERATIONS AND FINANCIAL CONDITION — (Continued)