Time Warner Cable 2006 Annual Report Download - page 82
Download and view the complete annual report
Please find page 82 of the 2006 Time Warner Cable annual report below. You can navigate through the pages in the report by either clicking on the pages listed below, or by using the keyword search tool below to find specific information within the annual report.-
 1
1 -
2
-
3
-
4
-
5
-
6
-
7
-
8
-
9
-
10
-
11
-
12
-
13
-
14
-
15
-
16
-
17
-
18
-
19
-
20
-
21
-
22
-
23
-
24
-
25
-
26
-
27
-
28
-
29
-
30
-
31
-
32
-
33
-
34
-
35
-
36
-
37
-
38
-
39
-
40
-
41
-
42
-
43
-
44
-
45
-
46
-
47
-
48
-
49
-
50
-
51
-
52
-
53
-
54
-
55
-
56
-
57
-
58
-
59
-
60
-
61
-
62
-
63
-
64
-
65
-
66
-
67
-
68
-
69
-
70
-
71
-
 72
72 -
 73
73 -
 74
74 -
 75
75 -
 76
76 -
 77
77 -
 78
78 -
 79
79 -
 80
80 -
 81
81 -
 82
82 -
 83
83 -
 84
84 -
 85
85 -
 86
86 -
 87
87 -
 88
88 -
 89
89 -
 90
90 -
 91
91 -
 92
92 -
93
-
94
-
95
-
96
-
97
-
98
-
99
-
100
-
101
-
102
-
103
-
104
-
105
-
106
-
107
-
108
-
109
-
110
-
111
-
112
-
113
-
114
-
115
-
116
-
117
-
118
-
119
-
120
-
121
-
122
-
123
-
124
-
125
-
126
-
127
-
128
-
129
-
130
-
131
-
132
-
133
-
134
-
135
-
136
-
137
-
138
-
139
-
140
-
141
-
142
-
143
-
144
-
145
-
146
-
147
-
148
-
149
-
150
-
151
-
152
-
153
-
154
-
155
-
156
-
157
-
158
-
159
-
160
-
161
-
162
-
163
-
164
-
165
-
166
 |
 |

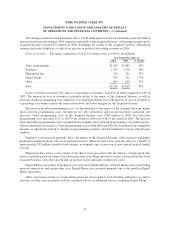
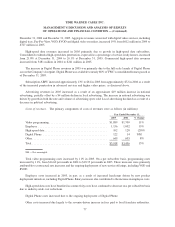
December 31, 2004 and December 31, 2005. Aggregate revenues associated with digital video services, including
digital tiers, Pay-Per-View, VOD, SVOD and digital video recorders, increased 19% from $612 million in 2004 to
$727 million in 2005.
High-speed data revenues increased in 2005 primarily due to growth in high-speed data subscribers.
Consolidated residential high-speed data penetration, expressed as a percentage of service-ready homes, increased
from 21.8% at December 31, 2004 to 26.1% at December 31, 2005. Commercial high-speed data revenues
increased from $181 million in 2004 to $241 million in 2005.
The increase in Digital Phone revenues in 2005 was primarily due to the full-scale launch of Digital Phone
across the Company’s footprint. Digital Phone was available to nearly 88% of TWC’s consolidated homes passed as
of December 31, 2005.
Subscription ARPU increased approximately 13% to $81 in 2005 from approximately $72 in 2004 as a result
of the increased penetration in advanced services and higher video prices, as discussed above.
Advertising revenues in 2005 increased as a result of an approximate $19 million increase in national
advertising, partially offset by a $4 million decline in local advertising. The increase in national advertising was
driven by growth in both the rate and volume of advertising spots sold. Local advertising declined as a result of a
decrease in political advertising.
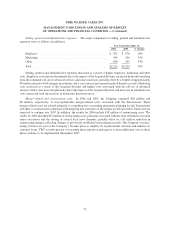
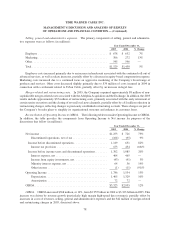
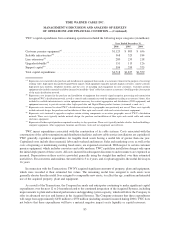
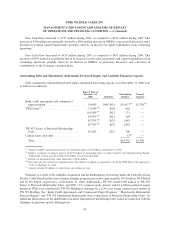
Costs of revenues. The primary components of costs of revenues were as follows (in millions):
2005 2004 % Change
Year Ended December 31,
Video programming ..................................... $1,889 $1,709 11%
Employee ............................................ 1,156 1,002 15%
High-speed data ........................................ 102 128 (20)%
Digital Phone ......................................... 122 14 NM
Other................................................ 649 603 8%
Total ................................................ $3,918 $3,456 13%
NM — Not meaningful.
Total video programming costs increased by 11% in 2005. On a per subscriber basis, programming costs
increased by 11%, from $16.60 per month in 2004 to $18.35 per month in 2005. These increases were primarily
attributable to contractual rate increases and the ongoing deployment of new service offerings, including VOD and
SVOD.
Employee costs increased in 2005, in part, as a result of increased headcount driven by new product
deployment initiatives, including Digital Phone. Salary increases also contributed to the increase in employee costs.
High-speed data costs have benefited as connectivity costs have continued to decrease on a per subscriber basis
due to industry-wide cost reductions.
Digital Phone costs increased due to the ongoing deployment of Digital Phone.
Other costs increased due largely to the revenue-driven increase in fees paid to local franchise authorities.
77
TIME WARNER CABLE INC.
MANAGEMENT’S DISCUSSION AND ANALYSIS OF RESULTS
OF OPERATIONS AND FINANCIAL CONDITION — (Continued)