Time Warner Cable 2006 Annual Report Download - page 76
Download and view the complete annual report
Please find page 76 of the 2006 Time Warner Cable annual report below. You can navigate through the pages in the report by either clicking on the pages listed below, or by using the keyword search tool below to find specific information within the annual report.-
 1
1 -
2
-
3
-
4
-
5
-
6
-
7
-
8
-
9
-
10
-
11
-
12
-
13
-
14
-
15
-
16
-
17
-
18
-
19
-
20
-
21
-
22
-
23
-
24
-
25
-
26
-
27
-
28
-
29
-
30
-
31
-
32
-
33
-
34
-
35
-
36
-
37
-
38
-
39
-
40
-
41
-
42
-
43
-
44
-
45
-
46
-
47
-
48
-
49
-
50
-
51
-
52
-
53
-
54
-
55
-
56
-
57
-
58
-
59
-
60
-
61
-
62
-
63
-
64
-
65
-
 66
66 -
 67
67 -
 68
68 -
 69
69 -
 70
70 -
 71
71 -
 72
72 -
 73
73 -
 74
74 -
 75
75 -
 76
76 -
 77
77 -
 78
78 -
 79
79 -
 80
80 -
 81
81 -
 82
82 -
 83
83 -
 84
84 -
 85
85 -
 86
86 -
87
-
88
-
89
-
90
-
91
-
92
-
93
-
94
-
95
-
96
-
97
-
98
-
99
-
100
-
101
-
102
-
103
-
104
-
105
-
106
-
107
-
108
-
109
-
110
-
111
-
112
-
113
-
114
-
115
-
116
-
117
-
118
-
119
-
120
-
121
-
122
-
123
-
124
-
125
-
126
-
127
-
128
-
129
-
130
-
131
-
132
-
133
-
134
-
135
-
136
-
137
-
138
-
139
-
140
-
141
-
142
-
143
-
144
-
145
-
146
-
147
-
148
-
149
-
150
-
151
-
152
-
153
-
154
-
155
-
156
-
157
-
158
-
159
-
160
-
161
-
162
-
163
-
164
-
165
-
166
 |
 |

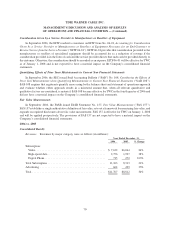
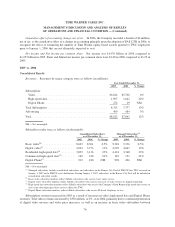
As previously reported, Adelphia and Comcast employed methodologies that differed slightly from those used
by TWC to determine subscriber numbers. As of September 30, 2006, TWC had converted subscriber numbers for
most of the Acquired Systems to TWC’s methodology. During the fourth quarter of 2006, TWC completed the
conversion of such data, which resulted in a reduction of approximately 46,000 basic video subscribers in the
Acquired Systems. Subscriber numbers are as follows (in thousands):
2006 2005 % Change 2006 2005 % Change
Consolidated Subscribers
as of December 31,
Managed Subscribers
(a)
as of December 31,
Basic video
(b)
...................... 12,614 8,603 47% 13,402 9,384 43%
Digital video
(c)
..................... 6,938 4,294 62% 7,270 4,595 58%
Residential high-speed data
(d)
.......... 6,270 3,839 63% 6,644 4,141 60%
Commercial high-speed data
(d)
......... 230 169 36% 245 183 34%
Digital Phone
(e)
..................... 1,719 913 88% 1,860 998 86%
(a)
Managed subscribers include consolidated subscribers and subscribers in the Kansas City Pool of TKCCP that TWC received on
January 1, 2007 in the TKCCP asset distribution. Starting January 1, 2007, subscribers in the Kansas City Pool will be included in
consolidated subscriber results.
(b)
Basic video subscriber numbers reflect billable subscribers who receive basic video service.
(c)
Digital video subscriber numbers reflect billable subscribers who receive any level of video service via digital technology.
(d)
High-speed data subscriber numbers reflect billable subscribers who receive the Company’s Road Runner high-speed data service or
any of the other high-speed data services offered by TWC.
(e)
Digital Phone subscriber numbers reflect billable subscribers who receive IP-based telephony service. Digital Phone subscribers
exclude subscribers acquired from Comcast in the Exchange who receive traditional, circuit-switched telephone service (which totaled
approximately 106,000 consolidated subscribers at December 31, 2006).
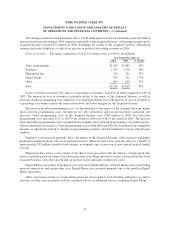
Subscription revenues increased in 2006 as a result of increases in video, high-speed data and Digital Phone
revenues. The increase in video revenues in 2006 was primarily due to the impact of the Acquired Systems, the
continued penetration of digital video services and video price increases and growth in basic video subscriber levels
in the Legacy Systems. Video revenues in the Acquired Systems totaled $1.165 billion in 2006. Aggregate revenues
associated with the Company’s digital video services, including digital tiers, Pay-Per-View, VOD, SVOD and
DVRs, increased 41% to $1.027 billion in 2006 from $727 million in 2005.
High-speed data revenues in 2006 increased primarily due to the Acquired Systems and growth in high-speed
data subscribers. High-speed data revenues in the Acquired Systems totaled $321 million in 2006. Consolidated
commercial high-speed data revenues increased to $318 million in 2006 from $241 million in 2005. Consolidated
residential high-speed data penetration, expressed as a percentage of service-ready homes, was 26.1% at both
December 31, 2006 and December 31, 2005 as a result of strong growth in the Legacy Systems offset by lower
penetration rates in the Acquired Systems. Strong growth rates for high-speed data service revenues are expected to
continue into 2007.
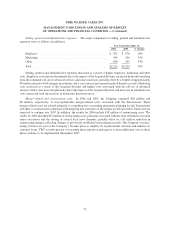
The increase in Digital Phone revenues in 2006 was primarily due to growth in Digital Phone subscribers.
Digital Phone revenues in 2006 also included approximately $27 million of revenues associated with subscribers
acquired from Comcast who received traditional, circuit-switched telephone service. As of December 31, 2006,
Digital Phone service was only available in some of the Acquired Systems on a limited basis. Consolidated Digital
Phone penetration, expressed as a percentage of service-ready homes, increased to 11.3% at December 31, 2006
from 7.0% at December 31, 2005. Strong growth rates for Digital Phone revenues are expected to continue into
2007.
Average monthly subscription revenue (which includes video, high-speed data and Digital Phone revenues)
per basic video subscriber (“subscription ARPU”) increased approximately 11% to $90 in 2006 from approximately
$81 in 2005 as a result of the increased penetration in advanced services and higher video rates, as discussed above.
71
TIME WARNER CABLE INC.
MANAGEMENT’S DISCUSSION AND ANALYSIS OF RESULTS
OF OPERATIONS AND FINANCIAL CONDITION — (Continued)