Time Warner Cable 2006 Annual Report Download - page 81
Download and view the complete annual report
Please find page 81 of the 2006 Time Warner Cable annual report below. You can navigate through the pages in the report by either clicking on the pages listed below, or by using the keyword search tool below to find specific information within the annual report.-
 1
1 -
2
-
3
-
4
-
5
-
6
-
7
-
8
-
9
-
10
-
11
-
12
-
13
-
14
-
15
-
16
-
17
-
18
-
19
-
20
-
21
-
22
-
23
-
24
-
25
-
26
-
27
-
28
-
29
-
30
-
31
-
32
-
33
-
34
-
35
-
36
-
37
-
38
-
39
-
40
-
41
-
42
-
43
-
44
-
45
-
46
-
47
-
48
-
49
-
50
-
51
-
52
-
53
-
54
-
55
-
56
-
57
-
58
-
59
-
60
-
61
-
62
-
63
-
64
-
65
-
66
-
67
-
68
-
69
-
70
-
 71
71 -
 72
72 -
 73
73 -
 74
74 -
 75
75 -
 76
76 -
 77
77 -
 78
78 -
 79
79 -
 80
80 -
 81
81 -
 82
82 -
 83
83 -
 84
84 -
 85
85 -
 86
86 -
 87
87 -
 88
88 -
 89
89 -
 90
90 -
 91
91 -
92
-
93
-
94
-
95
-
96
-
97
-
98
-
99
-
100
-
101
-
102
-
103
-
104
-
105
-
106
-
107
-
108
-
109
-
110
-
111
-
112
-
113
-
114
-
115
-
116
-
117
-
118
-
119
-
120
-
121
-
122
-
123
-
124
-
125
-
126
-
127
-
128
-
129
-
130
-
131
-
132
-
133
-
134
-
135
-
136
-
137
-
138
-
139
-
140
-
141
-
142
-
143
-
144
-
145
-
146
-
147
-
148
-
149
-
150
-
151
-
152
-
153
-
154
-
155
-
156
-
157
-
158
-
159
-
160
-
161
-
162
-
163
-
164
-
165
-
166
 |
 |

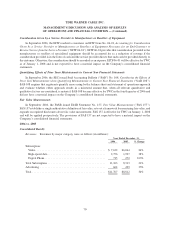
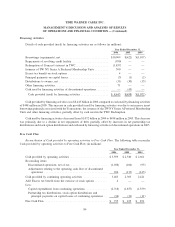
Cumulative effect of accounting change, net of tax. In 2006, the Company recorded a benefit of $2 million,
net of tax, as the cumulative effect of a change in accounting principle upon the adoption of FAS 123R in 2006, to
recognize the effect of estimating the number of Time Warner equity-based awards granted to TWC employees
prior to January 1, 2006 that are not ultimately expected to vest.
Net income and Net income per common share. Net income was $1.976 billion in 2006 compared to
$1.253 billion in 2005. Basic and diluted net income per common share were $2.00 in 2006 compared to $1.25 in
2005.
2005 vs. 2004
Consolidated Results
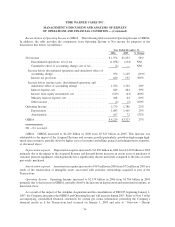
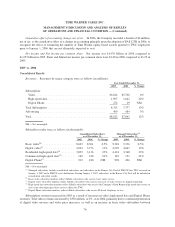
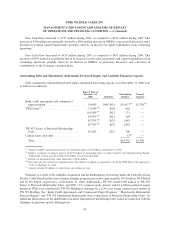
Revenues. Revenues by major category were as follows (in millions):
2005 2004 % Change
Year Ended December 31,
Subscription:
Video ............................................. $6,044 $5,706 6%
High-speed data ...................................... 1,997 1,642 22%
Digital Phone........................................ 272 29 NM
Total Subscription ...................................... 8,313 7,377 13%
Advertising ........................................... 499 484 3%
Total ................................................ $8,812 $7,861 12%
NM — Not meaningful.
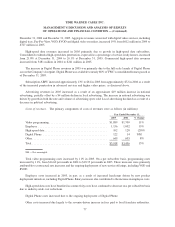
Subscriber results were as follows (in thousands):
2005 2004 % Change 2005 2004 % Change
Consolidated Subscribers
as of December 31,
Managed Subscribers
(a)
as of December 31,
Basic video
(b)
.................... 8,603 8,561 0.5% 9,384 9,336 0.5%
Digital video
(c)
................... 4,294 3,773 14% 4,595 4,067 13%
Residential high-speed data
(d)
........ 3,839 3,126 23% 4,141 3,368 23%
Commercial high-speed data
(d)
........ 169 140 21% 183 151 21%
Digital Phone
(e)
................... 913 180 NM 998 206 NM
NM — Not meaningful
(a)
Managed subscribers include consolidated subscribers and subscribers in the Kansas City Pool of TKCCP that TWC received on
January 1, 2007 in the TKCCP asset distribution. Starting January 1, 2007, subscribers in the Kansas City Pool will be included in
consolidated subscriber results.
(b)
Basic video subscriber numbers reflect billable subscribers who receive basic video service.
(c)
Digital video subscriber numbers reflect billable subscribers who receive any level of video service via digital technology.
(d)
High-speed data subscriber numbers reflect billable subscribers who receive the Company’s Road Runner high-speed data service or
any of the other high-speed data services offered by TWC.
(e)
Digital Phone subscriber numbers reflect billable subscribers who receive IP-based telephony service.
Subscription revenues increased in 2005 as a result of increases in video, high-speed data and Digital Phone
revenues. Total video revenues increased by $338 million, or 6%, over 2004, primarily due to continued penetration
of digital video services and video price increases, as well as an increase in basic video subscribers between
76
TIME WARNER CABLE INC.
MANAGEMENT’S DISCUSSION AND ANALYSIS OF RESULTS
OF OPERATIONS AND FINANCIAL CONDITION — (Continued)