Time Warner Cable 2006 Annual Report Download - page 83
Download and view the complete annual report
Please find page 83 of the 2006 Time Warner Cable annual report below. You can navigate through the pages in the report by either clicking on the pages listed below, or by using the keyword search tool below to find specific information within the annual report.-
 1
1 -
2
-
3
-
4
-
5
-
6
-
7
-
8
-
9
-
10
-
11
-
12
-
13
-
14
-
15
-
16
-
17
-
18
-
19
-
20
-
21
-
22
-
23
-
24
-
25
-
26
-
27
-
28
-
29
-
30
-
31
-
32
-
33
-
34
-
35
-
36
-
37
-
38
-
39
-
40
-
41
-
42
-
43
-
44
-
45
-
46
-
47
-
48
-
49
-
50
-
51
-
52
-
53
-
54
-
55
-
56
-
57
-
58
-
59
-
60
-
61
-
62
-
63
-
64
-
65
-
66
-
67
-
68
-
69
-
70
-
71
-
72
-
 73
73 -
 74
74 -
 75
75 -
 76
76 -
 77
77 -
 78
78 -
 79
79 -
 80
80 -
 81
81 -
 82
82 -
 83
83 -
 84
84 -
 85
85 -
 86
86 -
 87
87 -
 88
88 -
 89
89 -
 90
90 -
 91
91 -
 92
92 -
 93
93 -
94
-
95
-
96
-
97
-
98
-
99
-
100
-
101
-
102
-
103
-
104
-
105
-
106
-
107
-
108
-
109
-
110
-
111
-
112
-
113
-
114
-
115
-
116
-
117
-
118
-
119
-
120
-
121
-
122
-
123
-
124
-
125
-
126
-
127
-
128
-
129
-
130
-
131
-
132
-
133
-
134
-
135
-
136
-
137
-
138
-
139
-
140
-
141
-
142
-
143
-
144
-
145
-
146
-
147
-
148
-
149
-
150
-
151
-
152
-
153
-
154
-
155
-
156
-
157
-
158
-
159
-
160
-
161
-
162
-
163
-
164
-
165
-
166
 |
 |

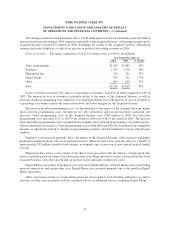
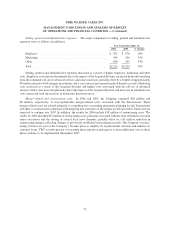
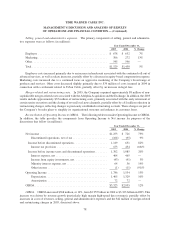
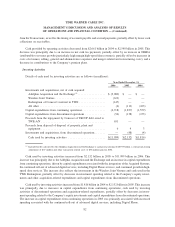
Selling, general and administrative expenses. The primary components of selling, general and administra-
tive expenses were as follows (in millions):
2005 2004 % Change
Year Ended December 31,
Employee ............................................ $ 678 $ 632 7%
Marketing ............................................ 306 272 13%
Other................................................ 545 546 —
Total ................................................ $1,529 $1,450 5%
Employee costs increased primarily due to an increase in headcount associated with the continued roll-out of
advanced services, as well as salary increases, partially offset by a decrease in equity-based compensation expense.
Marketing costs increased due to a continued focus on aggressive marketing of the Company’s broad range of
products and services. Other costs decreased slightly primarily due to $34 million of costs incurred in 2004 in
connection with a settlement related to Urban Cable, partially offset by an increase in legal fees.
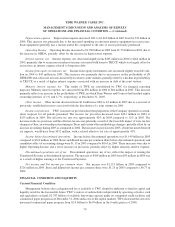
Merger-related and restructuring costs. In 2005, the Company expensed approximately $8 million of non-
capitalizable merger-related costs associated with the Adelphia Acquisition and the Exchange. In addition, the 2005
results include approximately $35 million of restructuring costs, primarily associated with the early retirement of
certain senior executives and the closing of several local news channels, partially offset by a $1 million reduction in
restructuring charges, reflecting changes to previously established restructuring accruals. These charges are part of
the Company’s broader plans to simplify its organizational structure and enhance its customer focus.
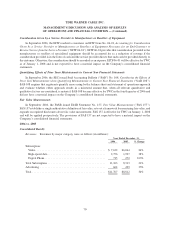
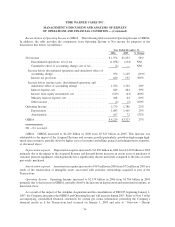
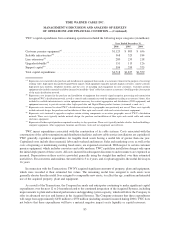
Reconciliation of Operating Income to OIBDA. The following table reconciles Operating Income to OIBDA.
In addition, the table provides the components from Operating Income to Net income for purposes of the
discussions that follow (in millions):
2005 2004 % Change
Year Ended December 31,
Net income ........................................... $1,253 $ 726 73%
Discontinued operations, net of tax ...................... (104) (95) 9%
Income before discontinued operations ..................... 1,149 631 82%
Income tax provision ................................ 153 454 (66)%
Income before income taxes and discontinued operations........ 1,302 1,085 20%
Interest expense, net . ................................ 464 465 —
Income from equity investments, net ..................... (43) (41) 5%
Minority interest expense, net .......................... 64 56 14%
Other income ...................................... (1) (11) (91)%
Operating Income ...................................... 1,786 1,554 15%
Depreciation....................................... 1,465 1,329 10%
Amortization ...................................... 72 72 —
OIBDA .............................................. $3,323 $2,955 12%
OIBDA. OIBDA increased $368 million, or 12%, from $2.955 billion in 2004 to $3.323 billion in 2005. This
increase was driven by revenue growth (particularly high margin high-speed data revenues), partially offset by
increases in costs of revenues, selling, general and administrative expenses and the $42 million of merger-related
and restructuring charges in 2005, discussed above.
78
TIME WARNER CABLE INC.
MANAGEMENT’S DISCUSSION AND ANALYSIS OF RESULTS
OF OPERATIONS AND FINANCIAL CONDITION — (Continued)