Time Warner Cable 2006 Annual Report Download - page 154
Download and view the complete annual report
Please find page 154 of the 2006 Time Warner Cable annual report below. You can navigate through the pages in the report by either clicking on the pages listed below, or by using the keyword search tool below to find specific information within the annual report.-
 1
1 -
2
-
3
-
4
-
5
-
6
-
7
-
8
-
9
-
10
-
11
-
12
-
13
-
14
-
15
-
16
-
17
-
18
-
19
-
20
-
21
-
22
-
23
-
24
-
25
-
26
-
27
-
28
-
29
-
30
-
31
-
32
-
33
-
34
-
35
-
36
-
37
-
38
-
39
-
40
-
41
-
42
-
43
-
44
-
45
-
46
-
47
-
48
-
49
-
50
-
51
-
52
-
53
-
54
-
55
-
56
-
57
-
58
-
59
-
60
-
61
-
62
-
63
-
64
-
65
-
66
-
67
-
68
-
69
-
70
-
71
-
72
-
73
-
74
-
75
-
76
-
77
-
78
-
79
-
80
-
81
-
82
-
83
-
84
-
85
-
86
-
87
-
88
-
89
-
90
-
91
-
92
-
93
-
94
-
95
-
96
-
97
-
98
-
99
-
100
-
101
-
102
-
103
-
104
-
105
-
106
-
107
-
108
-
109
-
110
-
111
-
112
-
113
-
114
-
115
-
116
-
117
-
118
-
119
-
120
-
121
-
122
-
123
-
124
-
125
-
126
-
127
-
128
-
129
-
130
-
131
-
132
-
133
-
134
-
135
-
136
-
137
-
138
-
139
-
140
-
141
-
142
-
143
-
 144
144 -
 145
145 -
 146
146 -
 147
147 -
 148
148 -
 149
149 -
 150
150 -
 151
151 -
 152
152 -
 153
153 -
 154
154 -
 155
155 -
 156
156 -
 157
157 -
 158
158 -
 159
159 -
 160
160 -
 161
161 -
 162
162 -
 163
163 -
 164
164 -
165
-
166
 |
 |

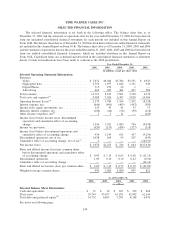
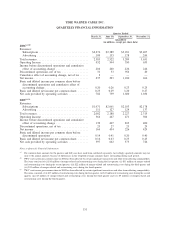
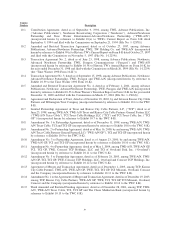
TIME WARNER CABLE INC.
SELECTED FINANCIAL INFORMATION
The selected financial information is set forth in the following tables. The balance sheet data as of
December 31, 2002 and the statement of operations data for the year ended December 31, 2002 has been derived
from our unaudited consolidated financial statements for such periods not included in this Annual Report on
Form 10-K. The balance sheet data as of December 31, 2003 has been derived from our audited financial statements
not included in this Annual Report on Form 10-K. The balance sheet data as of December 31, 2004, 2005 and 2006
and the statement of operations data for the years ended December 31, 2003, 2004, 2005 and 2006 has been derived
from our audited consolidated financial statements, which are included elsewhere in this Annual Report on
Form 10-K. Capitalized terms are as defined and described in the consolidated financial statements or elsewhere
herein. Certain reclassifications have been made to conform to the 2006 presentation.
2006 2005 2004 2003 2002
Year Ended December 31,
(in millions, except per share data)
Selected Operating Statement Information:
Revenues:
Video..................................... $ 7,632 $6,044 $5,706 $5,351 $ 4,923
High-speed data . ............................ 2,756 1,997 1,642 1,331 949
Digital Phone . . . ............................ 715 272 29 1 —
Advertising ................................ 664 499 484 437 504
Total revenues ................................ 11,767 8,812 7,861 7,120 6,376
Total costs and expenses
(a)
....................... 9,588 7,026 6,307 5,818 14,504
Operating Income (Loss)
(a)
....................... 2,179 1,786 1,554 1,302 (8,128)
Interest expense, net............................ (646) (464) (465) (492) (385)
Income from equity investments, net ............... 129 43 41 33 13
Minority interest expense, net..................... (108) (64) (56) (59) (118)
Other income (expense), net
(b)
.................... 2 1 11 — (420)
Income (loss) before income taxes, discontinued
operations and cumulative effect of accounting
change .................................... 1,556 1,302 1,085 784 (9,038)
Income tax provision ........................... (620) (153) (454) (327) (118)
Income (loss) before discontinued operations and
cumulative effect of accounting change ............ 936 1,149 631 457 (9,156)
Discontinued operations, net of tax ................. 1,038 104 95 207 (443)
Cumulative effect of accounting change, net of tax
(c)
. . . 2 — — — (28,031)
Net income (loss) . ............................ $ 1,976 $1,253 $ 726 $ 664 $(37,630)
Basic and diluted income (loss) per common share
before discontinued operations and cumulative effect
of accounting change ......................... $ 0.95 $ 1.15 $ 0.63 $ 0.48 $ (11.15)
Discontinued operations ......................... 1.05 0.10 0.10 0.22 (0.54)
Cumulative effect of accounting change ............. ————(34.14)
Basic and diluted net income (loss) per common share . . $ 2.00 $ 1.25 $ 0.73 $ 0.70 $ (45.83)
Weighted-average common shares ................. 990 1,000 1,000 955 821
2006 2005 2004 2003 2002
As of December 31,
(in millions)
Selected Balance Sheet Information:
Cash and equivalents ......................... $ 51 $ 12 $ 102 $ 329 $ 868
Total assets ................................ 55,743 43,677 43,138 42,902 62,146
Total debt and preferred equity
(d)
................ 14,732 6,863 7,299 8,368 6,976
See notes on following page.
149