Time Warner Cable 2006 Annual Report Download - page 89
Download and view the complete annual report
Please find page 89 of the 2006 Time Warner Cable annual report below. You can navigate through the pages in the report by either clicking on the pages listed below, or by using the keyword search tool below to find specific information within the annual report.-
 1
1 -
2
-
3
-
4
-
5
-
6
-
7
-
8
-
9
-
10
-
11
-
12
-
13
-
14
-
15
-
16
-
17
-
18
-
19
-
20
-
21
-
22
-
23
-
24
-
25
-
26
-
27
-
28
-
29
-
30
-
31
-
32
-
33
-
34
-
35
-
36
-
37
-
38
-
39
-
40
-
41
-
42
-
43
-
44
-
45
-
46
-
47
-
48
-
49
-
50
-
51
-
52
-
53
-
54
-
55
-
56
-
57
-
58
-
59
-
60
-
61
-
62
-
63
-
64
-
65
-
66
-
67
-
68
-
69
-
70
-
71
-
72
-
73
-
74
-
75
-
76
-
77
-
78
-
 79
79 -
 80
80 -
 81
81 -
 82
82 -
 83
83 -
 84
84 -
 85
85 -
 86
86 -
 87
87 -
 88
88 -
 89
89 -
 90
90 -
 91
91 -
 92
92 -
 93
93 -
 94
94 -
 95
95 -
 96
96 -
 97
97 -
 98
98 -
 99
99 -
100
-
101
-
102
-
103
-
104
-
105
-
106
-
107
-
108
-
109
-
110
-
111
-
112
-
113
-
114
-
115
-
116
-
117
-
118
-
119
-
120
-
121
-
122
-
123
-
124
-
125
-
126
-
127
-
128
-
129
-
130
-
131
-
132
-
133
-
134
-
135
-
136
-
137
-
138
-
139
-
140
-
141
-
142
-
143
-
144
-
145
-
146
-
147
-
148
-
149
-
150
-
151
-
152
-
153
-
154
-
155
-
156
-
157
-
158
-
159
-
160
-
161
-
162
-
163
-
164
-
165
-
166
 |
 |

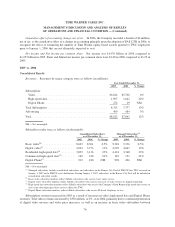
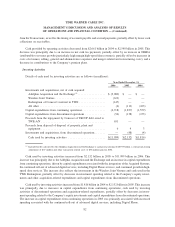
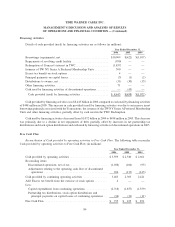
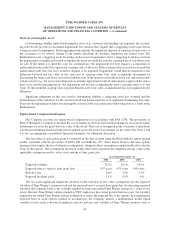
Financing Activities
Details of cash provided (used) by financing activities are as follows (in millions):
2006 2005 2004
Year Ended December 31,
Borrowings (repayments), net............................... $10,909 $(422) $(1,057)
Repayments of revolving credit facility........................ (950) — —
Redemption of Comcast’s interest in TWC ..................... (1,857) — —
Issuance of TW NY Series A Preferred Membership Units ......... 300 — —
Excess tax benefit on stock options .......................... 4 — —
Principal payments on capital leases.......................... (3) (1) (2)
Distributions to owners, net ................................ (31) (30) (13)
Other financing activities .................................. 71 — —
Cash used by financing activities of discontinued operations ........ — (45) —
Cash provided (used) by financing activities .................. $ 8,443 $(498) $(1,072)
Cash provided by financing activities was $8.443 billion in 2006 compared to cash used by financing activities
of $498 million in 2005. This increase in cash provided (used) by financing activities was due to an increase in net
borrowings primarily associated with the Transactions, the issuance of the TW NY Series A Preferred Membership
Units and other financing activities, partially offset by cash used in the TWC Redemption.
Cash used by financing activities decreased from $1.072 billion in 2004 to $498 million in 2005. This decrease
was primarily due to a decline in net repayments of debt, partially offset by increases in net partnership tax
distributions and stock option distributions and cash used by financing activities of discontinued operations in 2005.
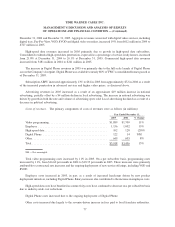
Free Cash Flow
Reconciliation of Cash provided by operating activities to Free Cash Flow. The following table reconciles
Cash provided by operating activities to Free Cash Flow (in millions):
2006 2005 2004
Year Ended December 31,
Cash provided by operating activities ........................ $3,595 $ 2,540 $ 2,661
Reconciling items:
Discontinued operations, net of tax ........................ (1,038) (104) (95)
Adjustments relating to the operating cash flow of discontinued
operations ........................................ 926 (133) (145)
Cash provided by continuing operating activities ............... 3,483 2,303 2,421
Add: Excess tax benefit from the exercise of stock options ........ 4 — —
Less:
Capital expenditures from continuing operations .............. (2,718) (1,837) (1,559)
Partnership tax distributions, stock option distributions and
principal payments on capital leases of continuing operations . . (34) (31) (11)
Free Cash Flow ........................................ $ 735 $ 435 $ 851
84
TIME WARNER CABLE INC.
MANAGEMENT’S DISCUSSION AND ANALYSIS OF RESULTS
OF OPERATIONS AND FINANCIAL CONDITION — (Continued)