Time Warner Cable 2006 Annual Report Download - page 84
Download and view the complete annual report
Please find page 84 of the 2006 Time Warner Cable annual report below. You can navigate through the pages in the report by either clicking on the pages listed below, or by using the keyword search tool below to find specific information within the annual report.-
 1
1 -
2
-
3
-
4
-
5
-
6
-
7
-
8
-
9
-
10
-
11
-
12
-
13
-
14
-
15
-
16
-
17
-
18
-
19
-
20
-
21
-
22
-
23
-
24
-
25
-
26
-
27
-
28
-
29
-
30
-
31
-
32
-
33
-
34
-
35
-
36
-
37
-
38
-
39
-
40
-
41
-
42
-
43
-
44
-
45
-
46
-
47
-
48
-
49
-
50
-
51
-
52
-
53
-
54
-
55
-
56
-
57
-
58
-
59
-
60
-
61
-
62
-
63
-
64
-
65
-
66
-
67
-
68
-
69
-
70
-
71
-
72
-
73
-
 74
74 -
 75
75 -
 76
76 -
 77
77 -
 78
78 -
 79
79 -
 80
80 -
 81
81 -
 82
82 -
 83
83 -
 84
84 -
 85
85 -
 86
86 -
 87
87 -
 88
88 -
 89
89 -
 90
90 -
 91
91 -
 92
92 -
 93
93 -
 94
94 -
95
-
96
-
97
-
98
-
99
-
100
-
101
-
102
-
103
-
104
-
105
-
106
-
107
-
108
-
109
-
110
-
111
-
112
-
113
-
114
-
115
-
116
-
117
-
118
-
119
-
120
-
121
-
122
-
123
-
124
-
125
-
126
-
127
-
128
-
129
-
130
-
131
-
132
-
133
-
134
-
135
-
136
-
137
-
138
-
139
-
140
-
141
-
142
-
143
-
144
-
145
-
146
-
147
-
148
-
149
-
150
-
151
-
152
-
153
-
154
-
155
-
156
-
157
-
158
-
159
-
160
-
161
-
162
-
163
-
164
-
165
-
166
 |
 |
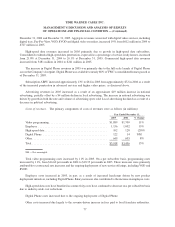
Depreciation expense. Depreciation expense increased 10% to $1.465 billion in 2005 from $1.329 billion in
2004. This increase was primarily due to the increased spending on customer premise equipment in recent years.
Such equipment generally has a shorter useful life compared to the mix of assets previously purchased.
Operating Income. Operating Income increased to $1.786 billion in 2005 from $1.554 billion in 2004, due to
the increase in OIBDA, partially offset by the increase in depreciation expense.
Interest expense, net. Interest expense, net, decreased slightly from $465 million in 2004 to $464 million in
2005, primarily due to an increase in interest income associated with loans to TKCCP, which was largely offset by
an increase in interest expense related to long-term debt.
Income from equity investments, net. Income from equity investments, net, increased slightly from $41 mil-
lion in 2004 to $43 million in 2005. This increase was primarily due to an increase in the profitability of iN
DEMAND and a decrease in losses incurred by local news joint ventures, partially offset by a decline in profitability
of TKCCP, as a result of higher interest expense associated with an increase in debt at the joint venture.
Minority interest expense, net. The results of TWE are consolidated by TWC for financial reporting
purposes. Minority interest expense, net, increased from $56 million in 2004 to $64 million in 2005. This increase
primarily reflects an increase in the profitability of TWE, in which Time Warner and Comcast had residual equity
ownership interests of 1% and 4.7%, respectively, at December 31, 2005.
Other income. Other income decreased from $11 million in 2004 to $1 million in 2005 due to a reversal of
previously established reserves associated with the dissolution of a joint venture in 2004.
Income tax provision. TWC’s income tax provision has been prepared as if the Company operated as a stand-
alone taxpayer for all periods presented. The income tax provision decreased from $454 million in 2004 to
$153 million in 2005. The effective tax rate was approximately 42% in 2004 compared to 12% in 2005. The
decrease in the tax provision and the effective tax rate was primarily a result of the favorable impact of state tax law
changes in Ohio, an ownership restructuring in Texas and certain other methodology changes, partially offset by an
increase in earnings during 2005 as compared to 2004. The income tax provision for 2005, absent the noted deferred
tax impacts, would have been $532 million, with a related effective tax rate of approximately 41%.
Income before discontinued operations. Income before discontinued operations was $1.149 billion in 2005
compared to $631 million in 2004. Basic and diluted income per common share before discontinued operations and
cumulative effect of accounting change were $1.15 in 2005 compared to $0.63 in 2004. These increases were due to
higher Operating Income and a lower income tax provision, partially offset by higher minority interest expense.
Discontinued operations, net of tax. Discontinued operations, net of tax, reflect the impact of treating the
Transferred Systems as discontinued operations. The increase to $104 million in 2005 from $95 million in 2004 was
as a result of higher earnings at the Transferred Systems.
Net income and Net income per common share. Net income was $1.253 billion in 2005 compared to
$726 million in 2004. Basic and diluted net income per common share were $1.25 in 2005 compared to $0.73 in
2004.
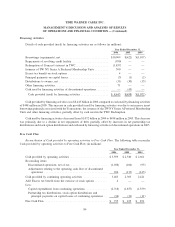
FINANCIAL CONDITION AND LIQUIDITY
Current Financial Condition
Management believes that cash generated by or available to TWC should be sufficient to fund its capital and
liquidity needs for the foreseeable future. TWC’s sources of cash include cash provided by operating activities, cash
and equivalents on hand, $2.747 billion of available borrowing capacity under its committed credit facilities and
commercial paper program as of December 31, 2006 and access to the capital markets. TWC increased the size of its
unsecured commercial paper program from $2.0 billion to $6.0 billion in the fourth quarter of 2006.
79
TIME WARNER CABLE INC.
MANAGEMENT’S DISCUSSION AND ANALYSIS OF RESULTS
OF OPERATIONS AND FINANCIAL CONDITION — (Continued)