Time Warner Cable 2006 Annual Report Download - page 87
Download and view the complete annual report
Please find page 87 of the 2006 Time Warner Cable annual report below. You can navigate through the pages in the report by either clicking on the pages listed below, or by using the keyword search tool below to find specific information within the annual report.-
 1
1 -
2
-
3
-
4
-
5
-
6
-
7
-
8
-
9
-
10
-
11
-
12
-
13
-
14
-
15
-
16
-
17
-
18
-
19
-
20
-
21
-
22
-
23
-
24
-
25
-
26
-
27
-
28
-
29
-
30
-
31
-
32
-
33
-
34
-
35
-
36
-
37
-
38
-
39
-
40
-
41
-
42
-
43
-
44
-
45
-
46
-
47
-
48
-
49
-
50
-
51
-
52
-
53
-
54
-
55
-
56
-
57
-
58
-
59
-
60
-
61
-
62
-
63
-
64
-
65
-
66
-
67
-
68
-
69
-
70
-
71
-
72
-
73
-
74
-
75
-
76
-
 77
77 -
 78
78 -
 79
79 -
 80
80 -
 81
81 -
 82
82 -
 83
83 -
 84
84 -
 85
85 -
 86
86 -
 87
87 -
 88
88 -
 89
89 -
 90
90 -
 91
91 -
 92
92 -
 93
93 -
 94
94 -
 95
95 -
 96
96 -
 97
97 -
98
-
99
-
100
-
101
-
102
-
103
-
104
-
105
-
106
-
107
-
108
-
109
-
110
-
111
-
112
-
113
-
114
-
115
-
116
-
117
-
118
-
119
-
120
-
121
-
122
-
123
-
124
-
125
-
126
-
127
-
128
-
129
-
130
-
131
-
132
-
133
-
134
-
135
-
136
-
137
-
138
-
139
-
140
-
141
-
142
-
143
-
144
-
145
-
146
-
147
-
148
-
149
-
150
-
151
-
152
-
153
-
154
-
155
-
156
-
157
-
158
-
159
-
160
-
161
-
162
-
163
-
164
-
165
-
166
 |
 |

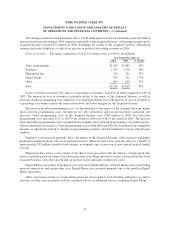
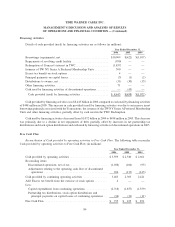
from the Transactions, as well as the timing of accounts payable and accrual payments, partially offset by lower cash
collections on receivables.
Cash provided by operating activities decreased from $2.661 billion in 2004 to $2.540 billion in 2005. This
decrease was principally due to an increase in net cash tax payments, partially offset by an increase in OIBDA
(attributable to revenue growth (particularly high margin high-speed data revenues), partially offset by increases in
costs of revenues, selling, general and administrative expenses and merger-related and restructuring costs), and a
decrease in contributions to the Company’s pension plans.
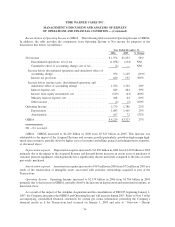
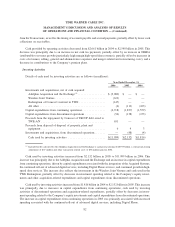
Investing Activities
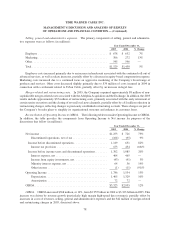
Details of cash used by investing activities are as follows (in millions):
2006 2005 2004
Year Ended December 31,
Investments and acquisitions, net of cash acquired:
Adelphia Acquisition and the Exchange
(a)
.................. $ (9,080) $ — $ —
Wireless Joint Venture ................................ (633) — —
Redemption of Comcast’s interest in TWE ................. (147) — —
All other .......................................... (2) (113) (103)
Capital expenditures from continuing operations ............... (2,718) (1,837) (1,559)
Capital expenditures from discontinued operations ............. (56) (138) (153)
Proceeds from the repayment by Comcast of TKCCP debt owed to
TWE-A/N . . ....................................... 631 — —
Proceeds from disposal of disposal of property, plant and
equipment . . ....................................... 6 4 3
Investments and acquisitions, from discontinued operations ....... — (48) (4)
Cash used by investing activities ........................ $(11,999) $(2,132) $(1,816)
(a)
Included in the cash used for the Adelphia Acquisition and the Exchange is cash paid at closing of $8.935 billion, a contractual closing
adjustment of $67 million and other transaction-related costs of $78 million paid in 2006.
Cash used by investing activities increased from $2.132 billion in 2005 to $11.999 billion in 2006. This
increase was principally due to the Adelphia Acquisition and the Exchange and an increase in capital expenditures
from continuing operations, driven by capital expenditures associated with the integration of the Acquired Systems,
the continued roll-out of advanced digital services, including Digital Phone services, and continued growth in high-
speed data services. The increase also reflects the investment in the Wireless Joint Venture and cash used in the
TWE Redemption, partially offset by decreases in investment spending related to the Company’s equity invest-
ments and other acquisition-related expenditures and capital expenditures from discontinued operations.
Cash used by investing activities increased from $1.816 billion in 2004 to $2.132 billion in 2005. This increase
was principally due to increases in capital expenditures from continuing operations, cash used by investing
activities of discontinued operations and acquisition-related expenditures, partially offset by decreases in invest-
ment spending related to the Company’s equity investments and capital expenditures from discontinued operations.
The increase in capital expenditures from continuing operations in 2005 was primarily associated with increased
spending associated with the continued roll-out of advanced digital services, including Digital Phone.
82
TIME WARNER CABLE INC.
MANAGEMENT’S DISCUSSION AND ANALYSIS OF RESULTS
OF OPERATIONS AND FINANCIAL CONDITION — (Continued)