Starwood 2009 Annual Report Download - page 97
Download and view the complete annual report
Please find page 97 of the 2009 Starwood annual report below. You can navigate through the pages in the report by either clicking on the pages listed below, or by using the keyword search tool below to find specific information within the annual report.-
 1
1 -
2
-
3
-
4
-
5
-
6
-
7
-
8
-
9
-
10
-
11
-
12
-
13
-
14
-
15
-
16
-
17
-
18
-
19
-
20
-
21
-
22
-
23
-
24
-
25
-
26
-
27
-
28
-
29
-
30
-
31
-
32
-
33
-
34
-
35
-
36
-
37
-
38
-
39
-
40
-
41
-
42
-
43
-
44
-
45
-
46
-
47
-
48
-
49
-
50
-
51
-
52
-
53
-
54
-
55
-
56
-
57
-
58
-
59
-
60
-
61
-
62
-
63
-
64
-
65
-
66
-
67
-
68
-
69
-
70
-
71
-
72
-
73
-
74
-
75
-
76
-
77
-
78
-
79
-
80
-
81
-
82
-
83
-
84
-
85
-
86
-
 87
87 -
 88
88 -
 89
89 -
 90
90 -
 91
91 -
 92
92 -
 93
93 -
 94
94 -
 95
95 -
 96
96 -
 97
97 -
 98
98 -
 99
99 -
 100
100 -
 101
101 -
 102
102 -
 103
103 -
 104
104 -
 105
105 -
 106
106 -
 107
107 -
108
-
109
-
110
-
111
-
112
-
113
-
114
-
115
-
116
-
117
-
118
-
119
-
120
-
121
-
122
-
123
-
124
-
125
-
126
-
127
-
128
-
129
-
130
-
131
-
132
-
133
-
134
-
135
-
136
-
137
-
138
-
139
-
140
-
141
-
142
-
143
-
144
-
145
-
146
-
147
-
148
-
149
-
150
-
151
-
152
-
153
-
154
-
155
-
156
-
157
-
158
-
159
-
160
-
161
-
162
-
163
-
164
-
165
-
166
-
167
-
168
-
169
-
170
-
171
-
172
-
173
-
174
-
175
-
176
-
177
 |
 |

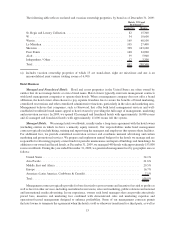
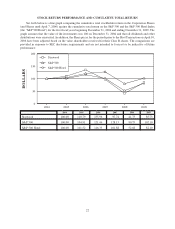
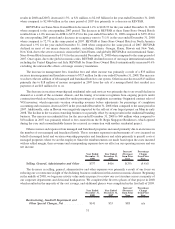
STOCK RETURN PERFORMANCE AND CUMULATIVE TOTAL RETURN
Set forth below is a line graph comparing the cumulative total stockholder return on the Corporation Shares
(and Shares until April 7, 2006) against the cumulative total return on the S&P 500 and the S&P 500 Hotel Index
(the “S&P 500 Hotel”) for the five fiscal years beginning December 31, 2004 and ending December 31, 2009. The
graph assumes that the value of the investments was 100 on December 31, 2004 and that all dividends and other
distributions were reinvested. In addition, the Share prices for the periods prior to the Host Transaction on April 10,
2006 have been adjusted based on the value shareholders received for their Class B shares. The comparisons are
provided in response to SEC disclosure requirements and are not intended to forecast or be indicative of future
performance.
200920082007200620052004
DOLLARS
Starwood
S&P 500
S&P 500 Hotel
0
50
100
150
200
2004 2005 2006 2007 2008 2009
Starwood 100.00 110.79 135.96 97.74 41.73 85.73
S&P 500 100.00 104.91 121.46 128.13 80.73 102.10
S&P 500 Hotel 100.00 101.52 116.35 101.88 52.68 82.10
22