Starwood 2009 Annual Report Download - page 105
Download and view the complete annual report
Please find page 105 of the 2009 Starwood annual report below. You can navigate through the pages in the report by either clicking on the pages listed below, or by using the keyword search tool below to find specific information within the annual report.-
 1
1 -
2
-
3
-
4
-
5
-
6
-
7
-
8
-
9
-
10
-
11
-
12
-
13
-
14
-
15
-
16
-
17
-
18
-
19
-
20
-
21
-
22
-
23
-
24
-
25
-
26
-
27
-
28
-
29
-
30
-
31
-
32
-
33
-
34
-
35
-
36
-
37
-
38
-
39
-
40
-
41
-
42
-
43
-
44
-
45
-
46
-
47
-
48
-
49
-
50
-
51
-
52
-
53
-
54
-
55
-
56
-
57
-
58
-
59
-
60
-
61
-
62
-
63
-
64
-
65
-
66
-
67
-
68
-
69
-
70
-
71
-
72
-
73
-
74
-
75
-
76
-
77
-
78
-
79
-
80
-
81
-
82
-
83
-
84
-
85
-
86
-
87
-
88
-
89
-
90
-
91
-
92
-
93
-
94
-
 95
95 -
 96
96 -
 97
97 -
 98
98 -
 99
99 -
 100
100 -
 101
101 -
 102
102 -
 103
103 -
 104
104 -
 105
105 -
 106
106 -
 107
107 -
 108
108 -
 109
109 -
 110
110 -
 111
111 -
 112
112 -
 113
113 -
 114
114 -
 115
115 -
116
-
117
-
118
-
119
-
120
-
121
-
122
-
123
-
124
-
125
-
126
-
127
-
128
-
129
-
130
-
131
-
132
-
133
-
134
-
135
-
136
-
137
-
138
-
139
-
140
-
141
-
142
-
143
-
144
-
145
-
146
-
147
-
148
-
149
-
150
-
151
-
152
-
153
-
154
-
155
-
156
-
157
-
158
-
159
-
160
-
161
-
162
-
163
-
164
-
165
-
166
-
167
-
168
-
169
-
170
-
171
-
172
-
173
-
174
-
175
-
176
-
177
 |
 |

During 2008, we recorded a net loss of $98 million primarily related to $64 million of impairment charges on
five hotels, a $22 million impairment of our investment in vacation ownership notes receivable that we have
previously securitized, and an $11 million write-off of our investment in a joint venture in which we hold minority
interest (see Note 5 of the consolidated financial statements).
Year Ended
December 31,
2009
Year Ended
December 31,
2008
Increase/
(Decrease)
from Prior
Year
Percentage
Change
from Prior
Year
Income Tax (Benefit) Expense ........... $(293) $72 $(365) n/a
The $365 million decrease in income tax expense primarily relates to a deferred tax benefit of $120 million
(net) in 2009 for an Italian tax incentive program in which the tax basis of land and buildings for the hotels we own
in Italy was stepped-up to fair value in exchange for paying a current tax of $9 million. The remaining decrease
primarily relates to tax benefits of $67 million associated with impairments, restructuring and asset sales and
$37 million related to a foreign tax credit election change. Additionally, a benefit of $10 million was recognized to
reverse the deferred interest accrual associated with the deferral of taxable income. The remaining decrease is
primarily due to lower pretax income.
Discontinued Operations, Net of Tax
During 2009, we sold our Bliss spa business and other non-core assets for cash proceeds of $227 million.
Revenues and expenses from the Bliss spa business, together with revenues and expenses from two hotels which are
in the process of being sold, have been reclassified to discontinued operations resulting in a loss of $2 million, net of
tax. In addition, the net gain on the assets sold in 2009 has been recorded in discontinued operations resulting in
income of $76 million, net of tax.
For the year ended December 31, 2008, the gain on dispositions includes a $124 million gain ($129 million pre
tax) on the sale of three properties which were sold unencumbered by management or franchise contracts. The tax
impact on this transaction was minimized due to the utilization of capital loss carryforwards. Additionally, in 2009,
$5 million was reclassified to discontinued operations (in the 2008 results) relating to two hotels that were in the
process of being sold at the end of 2009. Discontinued operations for the year ended December 31, 2008 also
includes a $49 million tax charge as a result of a 2008 administrative tax ruling for an unrelated taxpayer, that
impacts the tax liability associated with the disposition of one of our businesses several years ago.
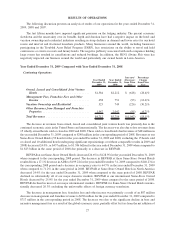
Year Ended December 31, 2008 Compared with Year Ended December 31, 2007
Continuing Operations
Year Ended
December 31,
2008
Year Ended
December 31,
2007
Increase/
(Decrease)
from Prior
Year
Percentage
Change
from Prior
Year
Owned, Leased and Consolidated Joint Venture
Hotels ............................... $2,212 $2,384 $(172) (7.2)%
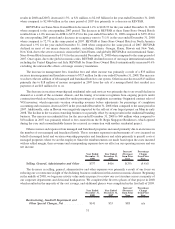
Management Fees, Franchise Fees and Other
Income .............................. 751 730 21 2.9%
Vacation Ownership and Residential .......... 749 1,025 (276) (26.9)%
Other Revenues from Managed and Franchise
Properties ............................ 2,042 1,860 182 9.8%
Total Revenues .......................... $5,754 $5,999 $(245) (4.1)%
The decrease in revenues from owned, leased and consolidated joint venture hotels was partially due to lost
revenues from 19 wholly owned hotels sold or closed in 2008 and 2007. These sold or closed hotels had revenues of
$77 million in the year ended December 31, 2008 compared to $121 million in the corresponding period of 2007.
Revenues at our Same-Store Owned Hotels (59 hotels for the year ended December 31, 2008 and 2007, excluding
the 19 hotels sold or closed and 10 additional hotels undergoing significant repositionings or without comparable
30