Starwood 2009 Annual Report Download - page 109
Download and view the complete annual report
Please find page 109 of the 2009 Starwood annual report below. You can navigate through the pages in the report by either clicking on the pages listed below, or by using the keyword search tool below to find specific information within the annual report.-
 1
1 -
2
-
3
-
4
-
5
-
6
-
7
-
8
-
9
-
10
-
11
-
12
-
13
-
14
-
15
-
16
-
17
-
18
-
19
-
20
-
21
-
22
-
23
-
24
-
25
-
26
-
27
-
28
-
29
-
30
-
31
-
32
-
33
-
34
-
35
-
36
-
37
-
38
-
39
-
40
-
41
-
42
-
43
-
44
-
45
-
46
-
47
-
48
-
49
-
50
-
51
-
52
-
53
-
54
-
55
-
56
-
57
-
58
-
59
-
60
-
61
-
62
-
63
-
64
-
65
-
66
-
67
-
68
-
69
-
70
-
71
-
72
-
73
-
74
-
75
-
76
-
77
-
78
-
79
-
80
-
81
-
82
-
83
-
84
-
85
-
86
-
87
-
88
-
89
-
90
-
91
-
92
-
93
-
94
-
95
-
96
-
97
-
98
-
 99
99 -
 100
100 -
 101
101 -
 102
102 -
 103
103 -
 104
104 -
 105
105 -
 106
106 -
 107
107 -
 108
108 -
 109
109 -
 110
110 -
 111
111 -
 112
112 -
 113
113 -
 114
114 -
 115
115 -
 116
116 -
 117
117 -
 118
118 -
 119
119 -
120
-
121
-
122
-
123
-
124
-
125
-
126
-
127
-
128
-
129
-
130
-
131
-
132
-
133
-
134
-
135
-
136
-
137
-
138
-
139
-
140
-
141
-
142
-
143
-
144
-
145
-
146
-
147
-
148
-
149
-
150
-
151
-
152
-
153
-
154
-
155
-
156
-
157
-
158
-
159
-
160
-
161
-
162
-
163
-
164
-
165
-
166
-
167
-
168
-
169
-
170
-
171
-
172
-
173
-
174
-
175
-
176
-
177
 |
 |

leisure travel. The impact of declining demand in the industry and higher hotel supply in key markets could have a
material impact on our sources of cash.
Our day-to-day operations are financed through a net working capital deficit, a practice that is common in our
industry. The ratio of our current assets to current liabilities was 0.74 and 0.81 as of December 31, 2009 and 2008,
respectively. Consistent with industry practice, we sweep the majority of the cash at our owned hotels on a daily
basis and fund payables as needed by drawing down on our existing revolving credit facility.
State and local regulations governing sales of VOIs and residential properties allow the purchaser of such a
VOI or property to rescind the sale subsequent to its completion for a pre-specified number of days. In addition, cash
payments received from buyers of units under construction are held in escrow during the period prior to obtaining a
certificate of occupancy. These payments and the deposits collected from sales during the rescission period are the
primary components of our restricted cash balances in our consolidated balance sheets. At December 31, 2009 and
2008, we had short-term restricted cash balances of $47 million and $96 million, respectively.
The 2009 securitization transactions resulted in cash from operating activities of approximately $300 million
and is discussed in our general liquidity discussion under cash from financing activities.
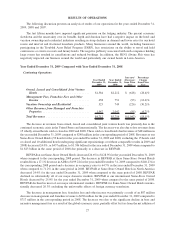
Cash From Investing Activities
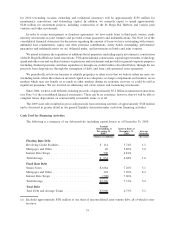
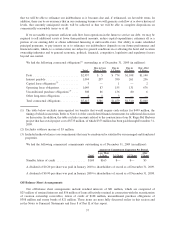
Gross capital spending during the full year ended December 31, 2009 was as follows (in millions):
Capital Expenditures:
Owned, Leased and Consolidated Joint Venture Hotels ............................ $102
Corporate and information technology ........................................ 27
Subtotal................................................................ 129
Vacation Ownership and Residential Capital Expenditures
(1)
:
Net capital expenditures for inventory (excluding St. Regis Bal Harbour) .............. (2)
Capital expenditures for inventory — St. Regis Bal Harbour ........................ 109
Subtotal................................................................ 107
Development Capital
(2)
.................................................... 107
Total Capital Expenditures ................................................ $343
(1) Represents gross inventory capital expenditures of $193 less cost of sales of $86.
(2) Includes $30 million of expenditures that are classified as Plant, property and equipment, net on the
consolidated balance sheet.
Gross capital spending during the year ended December 31, 2009 included approximately $132 million in
renovations of our wholly owned assets including construction costs at the W City Center in Chicago, IL, the Le
Centre Sheraton in Montreal, Canada, the Westin Peachtree Plaza in Atlanta, GA, and The Phoenician in Scottsdale,
AZ. Investment spending on gross VOI inventory was $193 million, which was offset by cost of sales of $86 million
associated with VOI sales. The inventory spend included VOI construction at the Westin Desert Willow Villas in
Palm Desert, CA, the Sheraton Vistana Villages in Orlando, FL, and the Westin Lagunamar Ocean Resort in
Cancun, as well as construction costs at the St. Regis Bal Harbour Resort in Miami Beach, FL.
As a result of the global economic climate, we scaled back our capital expenditures in 2009. Our capital
expenditure program includes both offensive and defensive capital. Defensive spend is related to repairs, main-
tenance, and renovations that we believe is necessary to stay competitive in the markets we are in. Other than capital
to address fire, life and safety issues, we consider defensive capital to be discretionary and reductions to this capital
program could result in decreases to our cash flow from operations, as hotels in certain markets could become less
desirable. The offensive capital expenditures, which are primarily related to new projects that we expect will
generate a return, are also considered discretionary. We currently anticipate that our defensive capital expenditures
34