Starwood 2009 Annual Report Download - page 37
Download and view the complete annual report
Please find page 37 of the 2009 Starwood annual report below. You can navigate through the pages in the report by either clicking on the pages listed below, or by using the keyword search tool below to find specific information within the annual report.-
 1
1 -
2
-
3
-
4
-
5
-
6
-
7
-
8
-
9
-
10
-
11
-
12
-
13
-
14
-
15
-
16
-
17
-
18
-
19
-
20
-
21
-
22
-
23
-
24
-
25
-
26
-
 27
27 -
 28
28 -
 29
29 -
 30
30 -
 31
31 -
 32
32 -
 33
33 -
 34
34 -
 35
35 -
 36
36 -
 37
37 -
 38
38 -
 39
39 -
 40
40 -
 41
41 -
 42
42 -
 43
43 -
 44
44 -
 45
45 -
 46
46 -
 47
47 -
48
-
49
-
50
-
51
-
52
-
53
-
54
-
55
-
56
-
57
-
58
-
59
-
60
-
61
-
62
-
63
-
64
-
65
-
66
-
67
-
68
-
69
-
70
-
71
-
72
-
73
-
74
-
75
-
76
-
77
-
78
-
79
-
80
-
81
-
82
-
83
-
84
-
85
-
86
-
87
-
88
-
89
-
90
-
91
-
92
-
93
-
94
-
95
-
96
-
97
-
98
-
99
-
100
-
101
-
102
-
103
-
104
-
105
-
106
-
107
-
108
-
109
-
110
-
111
-
112
-
113
-
114
-
115
-
116
-
117
-
118
-
119
-
120
-
121
-
122
-
123
-
124
-
125
-
126
-
127
-
128
-
129
-
130
-
131
-
132
-
133
-
134
-
135
-
136
-
137
-
138
-
139
-
140
-
141
-
142
-
143
-
144
-
145
-
146
-
147
-
148
-
149
-
150
-
151
-
152
-
153
-
154
-
155
-
156
-
157
-
158
-
159
-
160
-
161
-
162
-
163
-
164
-
165
-
166
-
167
-
168
-
169
-
170
-
171
-
172
-
173
-
174
-
175
-
176
-
177
 |
 |
• Upgraded our global pipeline tracking system and ongoing processes to provide a more effective man-
agement tool to monitor and drive global development activities and to enhance the accuracy of public
reporting of our pipeline activity;
• Completed a global assessment of strengths and weaknesses of our brands and orchestrated a global multi-
disciplinary analysis of growth prospects and hurdles in respect of certain brands; and
• Increased stability among the global development team, championed a team-focused personnel environ-
ment, and effected strategic transitions in key positions to improve team performance.
In light of Mr. Turner’s accomplishments in 2009, he received a “meets expectations” performance rating
and was awarded a payout at 85% of target for the strategic/operational portion of the annual bonus, for a total
annual bonus equal to 85% of his overall annual bonus target.
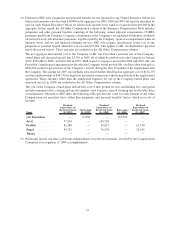
Overall, the Compensation Committee paid the Named Executive Officers individual bonuses under the
Executive Plan at 85% of target, which reflected the target payout based upon the Company’s financial
performance goals, and the contribution made by each of the Named Executive Officers under his strategic/
operational goals. In addition, the Compensation Committee awarded Messrs. van Paasschen and Prabhu
special one-time cash bonus enhancements in respect of their individual contributions in 2009.
Annual awards made to our Named Executive Officers under the Executive Plan with respect to 2009
performance are reflected in the Summary Compensation Table on page 34 and described in the accom-
panying narrative.
Long-Term Incentive Compensation. Like the annual incentives described above, long-term incentives
are a key part of the Company’s executive compensation program. Long-term incentives are strongly tied to
returns achieved by stockholders, providing a direct link between the interests of stockholders and the Named
Executive Officers. Long-term incentive compensation for our Named Executive Officers consists primarily of
equity compensation awards granted annually (in February of each year following the announcement of the
Company’s earnings for the previous year) under the Company’s LTIP and secondarily of the portion of the
Executive Plan awards that are deferred in the form of deferred stock awards. Taken together, approximately
63% of total compensation at target award levels is equity-based long-term incentive compensation.
The Compensation Committee grants awards under the LTIP to Mr. van Paasschen that are a combination
of stock options and restricted stock. Mr. van Paasschen’s employment agreement, which reflects an emphasis
on performance and long-term incentives, provides that in the event of strong financial and individual
performance Mr. van Paasschen benefits greatly in the form of long-term incentive compensation that, for the
2009 fiscal year, would not be less than $5,000,000. The Compensation Committee generally grants awards
under the LTIP to all other Named Executive Officers that are a combination of stock options and restricted
stock awards. For the other Named Executive Officers, compensation is also geared towards performance and
long-term incentives, but to a lesser degree than Mr. van Paasschen. The Compensation Committee believes an
emphasis on long-term equity compensation (i.e., stock options and restricted stock) is particularly appropriate
for the leader of a management team committed to the creation of stockholder value.
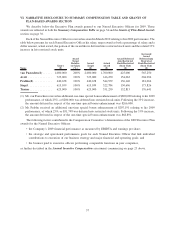
In 2009, for all Named Executive Officers the Compensation Committee used a grant approach in which
the award is articulated as a dollar value. Under this approach, an overall award value, in dollars, was
determined for each executive based upon our compensation strategy and competitive market positioning. The
Compensation Committee generally targeted the value of these awards so that total compensation at target
levels is set at the 65th percentile of our peer group, though individual awards may have been higher or lower
based on individual performance (determined as described in the Annual Incentive Compensation assessment
above).
The Compensation Committee determines the appropriate mix of restricted stock and stock options to be
given to our Named Executive Officers. For 2009, the Compensation Committee determined that a split of 75%
of restricted stock awards and 25% of stock options was the appropriate balance to maximize cost effectiveness
and encourage equity ownership among our management. The number of shares of restricted stock was
calculated by dividing 75% of the award value by the fair market value of the Company’s stock on the grant
28