Starwood 2009 Annual Report Download - page 147
Download and view the complete annual report
Please find page 147 of the 2009 Starwood annual report below. You can navigate through the pages in the report by either clicking on the pages listed below, or by using the keyword search tool below to find specific information within the annual report.-
 1
1 -
2
-
3
-
4
-
5
-
6
-
7
-
8
-
9
-
10
-
11
-
12
-
13
-
14
-
15
-
16
-
17
-
18
-
19
-
20
-
21
-
22
-
23
-
24
-
25
-
26
-
27
-
28
-
29
-
30
-
31
-
32
-
33
-
34
-
35
-
36
-
37
-
38
-
39
-
40
-
41
-
42
-
43
-
44
-
45
-
46
-
47
-
48
-
49
-
50
-
51
-
52
-
53
-
54
-
55
-
56
-
57
-
58
-
59
-
60
-
61
-
62
-
63
-
64
-
65
-
66
-
67
-
68
-
69
-
70
-
71
-
72
-
73
-
74
-
75
-
76
-
77
-
78
-
79
-
80
-
81
-
82
-
83
-
84
-
85
-
86
-
87
-
88
-
89
-
90
-
91
-
92
-
93
-
94
-
95
-
96
-
97
-
98
-
99
-
100
-
101
-
102
-
103
-
104
-
105
-
106
-
107
-
108
-
109
-
110
-
111
-
112
-
113
-
114
-
115
-
116
-
117
-
118
-
119
-
120
-
121
-
122
-
123
-
124
-
125
-
126
-
127
-
128
-
129
-
130
-
131
-
132
-
133
-
134
-
135
-
136
-
 137
137 -
 138
138 -
 139
139 -
 140
140 -
 141
141 -
 142
142 -
 143
143 -
 144
144 -
 145
145 -
 146
146 -
 147
147 -
 148
148 -
 149
149 -
 150
150 -
 151
151 -
 152
152 -
 153
153 -
 154
154 -
 155
155 -
 156
156 -
 157
157 -
158
-
159
-
160
-
161
-
162
-
163
-
164
-
165
-
166
-
167
-
168
-
169
-
170
-
171
-
172
-
173
-
174
-
175
-
176
-
177
 |
 |

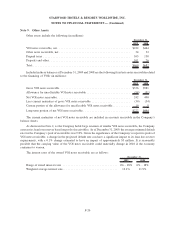
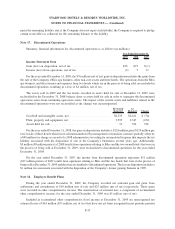
Note 11. Fair Value
The following table presents the Company’s fair value hierarchy for its financial assets and liabilities measured
at fair value on a recurring basis as of December 31, 2009 (in millions):
Level 1 Level 2 Level 3 Total
Assets:
Interest Rate Swaps ................................ $— $ 7 $— $ 7
Retained Interests.................................. — — 25 25
$— $ 7 $25 $32
Liabilities:
Forward contracts.................................. $— $ 7 $— $ 7
The forward contracts are over the counter contracts that do not trade on a public exchange. The fair values of
the contracts are based on inputs such as foreign currency spot rates and forward points that are readily available on
public markets, and as such, are classified as Level 2. The Company considered both its credit risk, as well as its
counterparties’ credit risk in determining fair value and no adjustment was made as it was deemed insignificant
based on the short duration of the contracts and the Company’s rate of short-term debt.
The interest rate swaps are valued using an income approach. Expected future cash flows are converted to a
present value amount based on market expectations of the yield curve on floating interest rates, which is readily
available on public markets.
The Company estimates the fair value of its Retained Interests using a discounted cash flow model with
unobservable inputs, which is considered Level 3. See Note 10 for the assumptions used to calculate the estimated
fair value and sensitivity analysis based on changes in assumptions.
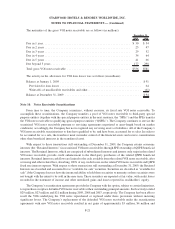
The following table presents a reconciliation of the Company’s Retained Interests measured at fair value on a
recurring basis using significant unobservable inputs (Level 3) for the year ended December 31, 2009 (in millions):
Balance at January 1, 2009 .................................................. $19
Total losses (realized/unrealized)
Included in earnings .................................................... (19)
Included in other comprehensive income..................................... 3
Purchases, issuances, and settlements ......................................... 22
Transfers in and/or out of Level 3 ........................................... —
Balance at December 31, 2009 ............................................... $25
Note 12. Deferred Gains
The Company defers gains realized in connection with the sale of a property for which the Company continues
to manage the property through a long-term management agreement and recognizes the gains over the initial term of
the related agreement. As of December 31, 2009 and 2008, the Company had total deferred gains of $1.093 billion
and $1.151 billion, respectively, included in accrued expenses and other liabilities in the Company’s consolidated
balance sheets. Amortization of deferred gains is included in management fees, franchise fees and other income in
the Company’s consolidated statements of income and totaled approximately $82 million, $83 million and
$81 million in 2009, 2008 and 2007, respectively.
F-24
STARWOOD HOTELS & RESORTS WORLDWIDE, INC.
NOTES TO FINANCIAL STATEMENTS — (Continued)