Starwood 2009 Annual Report Download - page 104
Download and view the complete annual report
Please find page 104 of the 2009 Starwood annual report below. You can navigate through the pages in the report by either clicking on the pages listed below, or by using the keyword search tool below to find specific information within the annual report.-
 1
1 -
2
-
3
-
4
-
5
-
6
-
7
-
8
-
9
-
10
-
11
-
12
-
13
-
14
-
15
-
16
-
17
-
18
-
19
-
20
-
21
-
22
-
23
-
24
-
25
-
26
-
27
-
28
-
29
-
30
-
31
-
32
-
33
-
34
-
35
-
36
-
37
-
38
-
39
-
40
-
41
-
42
-
43
-
44
-
45
-
46
-
47
-
48
-
49
-
50
-
51
-
52
-
53
-
54
-
55
-
56
-
57
-
58
-
59
-
60
-
61
-
62
-
63
-
64
-
65
-
66
-
67
-
68
-
69
-
70
-
71
-
72
-
73
-
74
-
75
-
76
-
77
-
78
-
79
-
80
-
81
-
82
-
83
-
84
-
85
-
86
-
87
-
88
-
89
-
90
-
91
-
92
-
93
-
 94
94 -
 95
95 -
 96
96 -
 97
97 -
 98
98 -
 99
99 -
 100
100 -
 101
101 -
 102
102 -
 103
103 -
 104
104 -
 105
105 -
 106
106 -
 107
107 -
 108
108 -
 109
109 -
 110
110 -
 111
111 -
 112
112 -
 113
113 -
 114
114 -
115
-
116
-
117
-
118
-
119
-
120
-
121
-
122
-
123
-
124
-
125
-
126
-
127
-
128
-
129
-
130
-
131
-
132
-
133
-
134
-
135
-
136
-
137
-
138
-
139
-
140
-
141
-
142
-
143
-
144
-
145
-
146
-
147
-
148
-
149
-
150
-
151
-
152
-
153
-
154
-
155
-
156
-
157
-
158
-
159
-
160
-
161
-
162
-
163
-
164
-
165
-
166
-
167
-
168
-
169
-
170
-
171
-
172
-
173
-
174
-
175
-
176
-
177
 |
 |

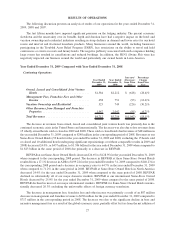
Year Ended
December 31,
2009
Year Ended
December 31,
2008
Increase/
(Decrease)
from Prior
Year
Percentage
Change
from Prior
Year
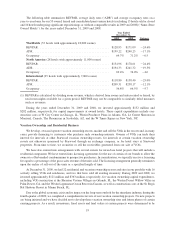
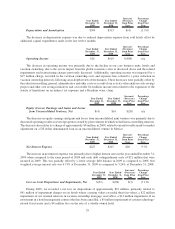
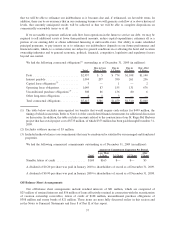
Depreciation and Amortization ........... $309 $313 $(4) (1.3)%
The decrease in depreciation expense was due to reduced depreciation expense from sold hotels offset by
additional capital expenditures made in the last twelve months.
Year Ended
December 31,
2009
Year Ended
December 31,
2008
Increase/
(Decrease)
from Prior
Year
Percentage
Change
from Prior
Year
Operating Income ..................... $26 $610 $(584) n/a
The decrease in operating income was primarily due to the decline in our core business units, hotels and
vacation ownership, due to the severe impact from the global economic crisis as discussed above and the related
impairments and restructuring charges previously discussed. Additionally, operating income was impacted by a
$17 million charge, recorded in the vacation ownership costs and expenses line, related to a price reduction in
vacation ownership intervals, following an in-depth review of the business. These decreases were partially offset by
the reduction in selling, general, administrative and other costs as a result of our activity value analysis costs savings
project and other cost savings initiatives and a favorable $14 million income item related to the expiration of the
statute of limitations on an indirect tax exposure and a Brazilian water claim.
Year Ended
December 31,
2009
Year Ended
December 31,
2008
Increase/
(Decrease)
from Prior
Year
Percentage
Change
from Prior
Year
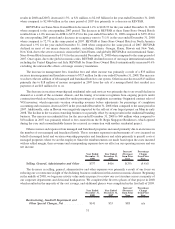
Equity (Losses) Earnings and Gains and Losses
from Unconsolidated Ventures, Net ......... $(4) $16 $(20) n/a
The decrease in equity earnings and gains and losses from unconsolidated joint ventures was primarily due to
decreased operating results at several properties owned by joint ventures in which we hold non-controlling interests.
The decrease also relates to a charge of approximately $4 million, in 2009, related to an unfavorable mark-to-market
adjustment on a US dollar denominated loan in an unconsolidated venture in Mexico.
Year Ended
December 31,
2009
Year Ended
December 31,
2008
Increase/
(Decrease)
from Prior
Year
Percentage
Change
from Prior
Year
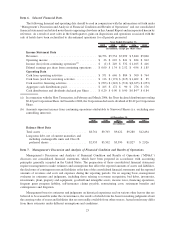
Net Interest Expense ................... $227 $207 $20 9.7%
The increase in net interest expense was primarily due to higher interest rates in the year ended December 31,
2009 when compared to the same period of 2008 and early debt extinguishment costs of $21 million that were
incurred in 2009. This was partially offset by a lower average debt balance in 2009 as compared to 2008. Our
weighted average interest rate was 6.73% at December 31, 2009 as compared to 5.24% at December 31, 2008.
Year Ended
December 31,
2009
Year Ended
December 31,
2008
Increase/
(Decrease)
from Prior
Year
Percentage
Change
from Prior
Year
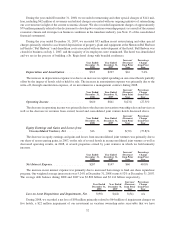
Loss on Asset Dispositions and Impairments, Net . . $(91) $(98) $(7) (7.1)%
During 2009, we recorded a net loss on dispositions of approximately $91 million, primarily related to
$41 million of impairment charges on six hotels whose carrying values exceeded their fair values, a $22 million
impairment of our retained interests in vacation ownership mortgage receivables, a $13 million impairment of an
investment in a hotel management contract that has been cancelled, a $5 million impairment of certain technology-
related fixed assets and a $4 million loss on the sale of a wholly-owned hotel.
29