Starwood 2009 Annual Report Download - page 92
Download and view the complete annual report
Please find page 92 of the 2009 Starwood annual report below. You can navigate through the pages in the report by either clicking on the pages listed below, or by using the keyword search tool below to find specific information within the annual report.-
 1
1 -
2
-
3
-
4
-
5
-
6
-
7
-
8
-
9
-
10
-
11
-
12
-
13
-
14
-
15
-
16
-
17
-
18
-
19
-
20
-
21
-
22
-
23
-
24
-
25
-
26
-
27
-
28
-
29
-
30
-
31
-
32
-
33
-
34
-
35
-
36
-
37
-
38
-
39
-
40
-
41
-
42
-
43
-
44
-
45
-
46
-
47
-
48
-
49
-
50
-
51
-
52
-
53
-
54
-
55
-
56
-
57
-
58
-
59
-
60
-
61
-
62
-
63
-
64
-
65
-
66
-
67
-
68
-
69
-
70
-
71
-
72
-
73
-
74
-
75
-
76
-
77
-
78
-
79
-
80
-
81
-
 82
82 -
 83
83 -
 84
84 -
 85
85 -
 86
86 -
 87
87 -
 88
88 -
 89
89 -
 90
90 -
 91
91 -
 92
92 -
 93
93 -
 94
94 -
 95
95 -
 96
96 -
 97
97 -
 98
98 -
 99
99 -
 100
100 -
 101
101 -
 102
102 -
103
-
104
-
105
-
106
-
107
-
108
-
109
-
110
-
111
-
112
-
113
-
114
-
115
-
116
-
117
-
118
-
119
-
120
-
121
-
122
-
123
-
124
-
125
-
126
-
127
-
128
-
129
-
130
-
131
-
132
-
133
-
134
-
135
-
136
-
137
-
138
-
139
-
140
-
141
-
142
-
143
-
144
-
145
-
146
-
147
-
148
-
149
-
150
-
151
-
152
-
153
-
154
-
155
-
156
-
157
-
158
-
159
-
160
-
161
-
162
-
163
-
164
-
165
-
166
-
167
-
168
-
169
-
170
-
171
-
172
-
173
-
174
-
175
-
176
-
177
 |
 |

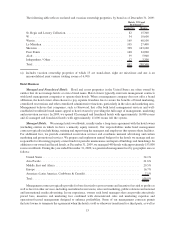
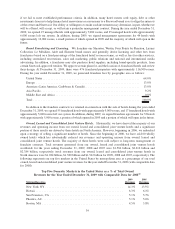
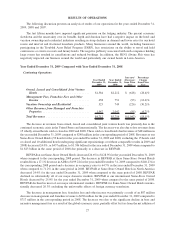
The following represents our top five international markets by country as a percentage of our total owned,
leased and consolidated joint venture revenues for the year ended December 31, 2009 (with comparable data for
2008):
Top Five International Markets as a % of Total Owned
Revenues for the Year Ended December 31, 2009 with Comparable Data for 2008
(1)
Country
2009
Revenues
2008
Revenues
Canada ...................................................... 9.3% 9.0%
Italy ........................................................ 7.6% 8.5%
Australia..................................................... 5.3% 4.8%
Mexico ...................................................... 4.7% 5.4%
Austria ...................................................... 2.8% 2.8%
(1) Includes the revenues of hotels sold for the period prior to their sale.
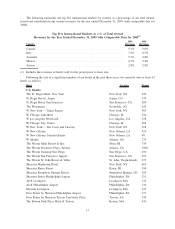
Following the sale of a significant number of our hotels in the past three years, we currently own or lease 63
hotels as follows:
Hotel Location Rooms
U.S. Hotels:
The St. Regis Hotel, New York New York, NY 229
St. Regis Resort, Aspen Aspen, CO 179
St. Regis Hotel, San Francisco San Francisco, CA 260
The Phoenician Scottsdale, AZ 643
W New York — Times Square New York, NY 509
W Chicago Lakeshore Chicago, IL 520
W Los Angeles Westwood Los Angeles, CA 258
W Chicago City Center Chicago, IL 369
W New York — The Court and Tuscany New York, NY 318
W New Orleans New Orleans, LA 423
W New Orleans, French Quarter New Orleans, LA 98
W Atlanta Atlanta, GA 275
The Westin Maui Resort & Spa Maui, HI 759
The Westin Peachtree Plaza, Atlanta Atlanta, GA 1068
The Westin Gaslamp San Diego San Diego, CA 450
The Westin San Francisco Airport San Francisco, CA 397
The Westin St. John Resort & Villas St. John, Virgin Islands 175
Sheraton Manhattan Hotel New York, NY 665
Sheraton Kauai Resort Kauai, HI 394
Sheraton Steamboat Springs Resort Steamboat Springs, CO 205
Sheraton Suites Philadelphia Airport Philadelphia, PA 251
Aloft Lexington Lexington, MA 136
Aloft Philadelphia Airport Philadelphia, PA 136
Element Lexington Lexington, MA 123
Four Points by Sheraton Philadelphia Airport Philadelphia, PA 177
Four Points by Sheraton Tucson University Plaza Tucson, AZ 150
The Boston Park Plaza Hotel & Towers Boston, MA 941
17