Starwood 2009 Annual Report Download - page 110
Download and view the complete annual report
Please find page 110 of the 2009 Starwood annual report below. You can navigate through the pages in the report by either clicking on the pages listed below, or by using the keyword search tool below to find specific information within the annual report.-
 1
1 -
2
-
3
-
4
-
5
-
6
-
7
-
8
-
9
-
10
-
11
-
12
-
13
-
14
-
15
-
16
-
17
-
18
-
19
-
20
-
21
-
22
-
23
-
24
-
25
-
26
-
27
-
28
-
29
-
30
-
31
-
32
-
33
-
34
-
35
-
36
-
37
-
38
-
39
-
40
-
41
-
42
-
43
-
44
-
45
-
46
-
47
-
48
-
49
-
50
-
51
-
52
-
53
-
54
-
55
-
56
-
57
-
58
-
59
-
60
-
61
-
62
-
63
-
64
-
65
-
66
-
67
-
68
-
69
-
70
-
71
-
72
-
73
-
74
-
75
-
76
-
77
-
78
-
79
-
80
-
81
-
82
-
83
-
84
-
85
-
86
-
87
-
88
-
89
-
90
-
91
-
92
-
93
-
94
-
95
-
96
-
97
-
98
-
99
-
 100
100 -
 101
101 -
 102
102 -
 103
103 -
 104
104 -
 105
105 -
 106
106 -
 107
107 -
 108
108 -
 109
109 -
 110
110 -
 111
111 -
 112
112 -
 113
113 -
 114
114 -
 115
115 -
 116
116 -
 117
117 -
 118
118 -
 119
119 -
 120
120 -
121
-
122
-
123
-
124
-
125
-
126
-
127
-
128
-
129
-
130
-
131
-
132
-
133
-
134
-
135
-
136
-
137
-
138
-
139
-
140
-
141
-
142
-
143
-
144
-
145
-
146
-
147
-
148
-
149
-
150
-
151
-
152
-
153
-
154
-
155
-
156
-
157
-
158
-
159
-
160
-
161
-
162
-
163
-
164
-
165
-
166
-
167
-
168
-
169
-
170
-
171
-
172
-
173
-
174
-
175
-
176
-
177
 |
 |

for 2010 (excluding vacation ownership and residential inventory) will be approximately $150 million for
maintenance, renovations, and technology capital. In addition, we currently expect to spend approximately
$240 million for investment projects, including construction of the St. Regis Bal Harbour and various joint
ventures and other investments.
In order to secure management or franchise agreements, we have made loans to third-party owners, made
minority investments in joint ventures and provided certain guarantees and indemnifications. See Note 24 of the
consolidated financial statements for discussion regarding the amount of loans we have outstanding with owners,
unfunded loan commitments, equity and other potential contributions, surety bonds outstanding, performance
guarantees and indemnifications we are obligated under, and investments in hotels and joint ventures.
We intend to finance the acquisition of additional hotel properties (including equity investments), construction
of the St. Regis Bal Harbour, hotel renovations, VOI and residential construction, capital improvements, technology
spend and other core and ancillary business acquisitions and investments and provide for general corporate purposes
(including dividend payments and share repurchases) through our credit facilities described below, through the net
proceeds from dispositions, through the assumption of debt, and from cash generated from operations.
We periodically review our business to identify properties or other assets that we believe either are non-core
(including hotels where the return on invested capital is not adequate), no longer complement our business, are in
markets which may not benefit us as much as other markets during an economic recovery or could be sold at
significant premiums. We are focused on enhancing real estate returns and monetizing investments.
Since 2006, we have sold 60 hotels realizing proceeds of approximately $5.2 billion in numerous transactions
(see Note 5 of the consolidated financial statements). There can be no assurance, however, that we will be able to
complete future dispositions on commercially reasonable terms or at all.
The 2009 asset sales resulted in gross cash proceeds from investing activities of approximately $328 million
and is discussed in greater detail in our general liquidity discussion under cash from financing activities.
Cash Used for Financing Activities
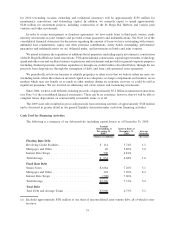
The following is a summary of our debt portfolio (including capital leases) as of December 31, 2009:
Amount
Outstanding at
December 31,
2009
(a)
Interest Rate at
December 31,
2009
Average
Maturity
(Dollars in millions) (In years)
Floating Rate Debt
Revolving Credit Facilities .................... $ 114 3.74% 1.1
Mortgages and Other . . . ..................... 40 5.80% 3.0
Interest Rate Swaps ......................... 500 4.81%
Total/Average ............................. $ 654 4.68% 1.6
Fixed Rate Debt
Senior Notes .............................. $2,684 7.26% 5.1
Mortgages and Other . . . ..................... 122 7.49% 8.2
Interest Rate Swaps ......................... (500) 7.06%
Total/Average ............................. $2,306 7.31% 5.2
Total Debt
Total Debt and Average Terms ................. $2,960 6.73% 5.1
(a) Excludes approximately $581 million of our share of unconsolidated joint venture debt, all of which is non-
recourse.
35