Starwood 2009 Annual Report Download - page 94
Download and view the complete annual report
Please find page 94 of the 2009 Starwood annual report below. You can navigate through the pages in the report by either clicking on the pages listed below, or by using the keyword search tool below to find specific information within the annual report.-
 1
1 -
2
-
3
-
4
-
5
-
6
-
7
-
8
-
9
-
10
-
11
-
12
-
13
-
14
-
15
-
16
-
17
-
18
-
19
-
20
-
21
-
22
-
23
-
24
-
25
-
26
-
27
-
28
-
29
-
30
-
31
-
32
-
33
-
34
-
35
-
36
-
37
-
38
-
39
-
40
-
41
-
42
-
43
-
44
-
45
-
46
-
47
-
48
-
49
-
50
-
51
-
52
-
53
-
54
-
55
-
56
-
57
-
58
-
59
-
60
-
61
-
62
-
63
-
64
-
65
-
66
-
67
-
68
-
69
-
70
-
71
-
72
-
73
-
74
-
75
-
76
-
77
-
78
-
79
-
80
-
81
-
82
-
83
-
 84
84 -
 85
85 -
 86
86 -
 87
87 -
 88
88 -
 89
89 -
 90
90 -
 91
91 -
 92
92 -
 93
93 -
 94
94 -
 95
95 -
 96
96 -
 97
97 -
 98
98 -
 99
99 -
 100
100 -
 101
101 -
 102
102 -
 103
103 -
 104
104 -
105
-
106
-
107
-
108
-
109
-
110
-
111
-
112
-
113
-
114
-
115
-
116
-
117
-
118
-
119
-
120
-
121
-
122
-
123
-
124
-
125
-
126
-
127
-
128
-
129
-
130
-
131
-
132
-
133
-
134
-
135
-
136
-
137
-
138
-
139
-
140
-
141
-
142
-
143
-
144
-
145
-
146
-
147
-
148
-
149
-
150
-
151
-
152
-
153
-
154
-
155
-
156
-
157
-
158
-
159
-
160
-
161
-
162
-
163
-
164
-
165
-
166
-
167
-
168
-
169
-
170
-
171
-
172
-
173
-
174
-
175
-
176
-
177
 |
 |

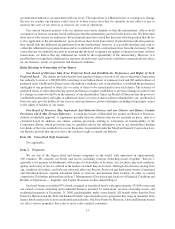
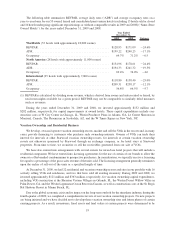
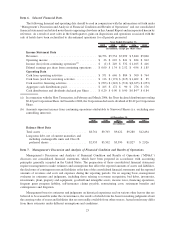
The following table summarizes REVPAR, average daily rates (“ADR”) and average occupancy rates on a
year-to-year basis for our 53 owned, leased and consolidated joint venture hotels (excluding 15 hotels sold or closed
and 10 hotels undergoing significant repositionings or without comparable results in 2009 and 2008) (“Same-Store
Owned Hotels”) for the years ended December 31, 2009 and 2008:
2009 2008 Variance
Year Ended
December 31,
Worldwide (53 hotels with approximately 18,000 rooms)
REVPAR ............................................ $128.95 $171.09 ⫺24.6%
ADR............................................... $199.22 $240.23 ⫺17.1%
Occupancy ........................................... 64.7% 71.2% ⫺6.5
North America (28 hotels with approximately 11,000 rooms)
REVPAR ............................................ $134.96 $178.61 ⫺24.4%
ADR............................................... $194.33 $241.32 ⫺19.5%
Occupancy ........................................... 69.4% 74.0% ⫺4.6
International (25 hotels with approximately 7,000 rooms)
REVPAR ............................................ $118.80 $158.40 ⫺25.0%
ADR............................................... $209.31 $238.17 ⫺12.1%
Occupancy ........................................... 56.8% 66.5% ⫺9.7
(1) REVPAR is calculated by dividing room revenue, which is derived from rooms and suites rented or leased, by
total room nights available for a given period. REVPAR may not be comparable to similarly titled measures
such as revenues.
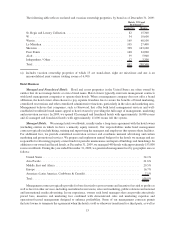
During the years ended December 31, 2009 and 2008, we invested approximately $132 million and
$282 million, respectively, for capital improvements at owned hotels. These capital expenditures include con-
struction costs at W City Center in Chicago, IL, Westin Peachtree Plaza in Atlanta, GA, Le Centre Sheraton in
Montreal, Canada, The Phoenician in Scottsdale, AZ, and the W Times Square in New York, NY.
Vacation Ownership and Residential Business
We develop, own and operate vacation ownership resorts, market and sell the VOIs in the resorts and, in many
cases, provide financing to customers who purchase such ownership interests. Owners of VOIs can trade their
interval for intervals at other Starwood vacation ownership resorts, for intervals at certain vacation ownership
resorts not otherwise sponsored by Starwood through an exchange company, or for hotel stays at Starwood
properties. From time to time, we securitize or sell the receivables generated from our sale of VOIs.
We have also entered into arrangements with several owners for mixed use hotel projects that will include a
residential component. We have entered into licensing agreements for the use of certain of our brands to allow the
owners to offer branded condominiums to prospective purchasers. In consideration, we typically receive a licensing
fee equal to a percentage of the gross sales revenue of the units sold. The licensing arrangement generally terminates
upon the earlier of sell-out of the units or a specified length of time.
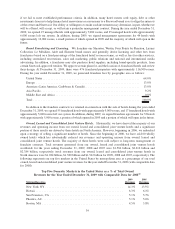
At December 31, 2009, we had 22 residential and vacation ownership resorts and sites in our portfolio with 16
actively selling VOIs and residences, and two that have sold all existing inventory. During 2009 and 2008, we
invested approximately $121 million and $363 million, respectively, for vacation ownership capital expenditures,
including VOI construction at the Sheraton Vistana Villages in Orlando, FL, the Westin Desert Willow Villas in
Palm Desert, CA, and the Westin Lagunamar Ocean Resort in Cancun, as well as construction costs at the St. Regis
Bal Harbour Resort in Miami Beach, FL.
Due to the global economic crisis and its impact on the long-term outlook for the timeshare industry, during the
fourth quarter of 2009, we completed a comprehensive review of our vacation ownership projects. No new projects
are being initiated and we have decided not to develop three vacation ownership sites and future phases of certain
existing projects. As a result, inventories, fixed assets and land values at certain projects were determined to be
19